
Compare Ellen.Indl.Gas with Similar Stocks
Dashboard
Flat results in Mar 26
- INTEREST(Q) At Rs 2.33 cr has Grown at 56.38%
- PAT(Q) At Rs 22.88 cr has Fallen at -8.3% (vs previous 4Q average)
- NON-OPERATING INCOME(Q) is 43.71 % of Profit Before Tax (PBT)
With ROE of 11.3, it has a Very Expensive valuation with a 4.3 Price to Book Value
Falling Participation by Institutional Investors
Stock DNA
Other Chemical products
INR 3,967 Cr (Small Cap)
38.00
23
0.00%
-0.06
11.32%
4.29
Total Returns (Price + Dividend) 
Latest dividend: 0.5000 per share ex-dividend date: Sep-17-2012
Risk Adjusted Returns v/s
Returns Beta

News
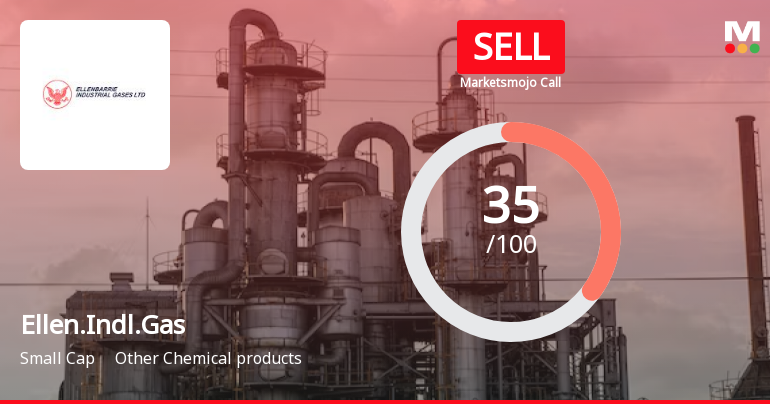
Ellenbarrie Industrial Gases Ltd is Rated Sell
Ellenbarrie Industrial Gases Ltd is rated Sell by MarketsMOJO, with this rating last updated on 22 Dec 2025. However, the analysis and financial metrics discussed here reflect the stock's current position as of 14 June 2026, providing investors with an up-to-date view of the company’s fundamentals, valuation, financial trends, and technical outlook.
Read full news article
Ellenbarrie Industrial Gases Ltd Surges 7.58% to Day's High of Rs 277.55 — Outperforms Sector by 3.95 Percentage Points
The Sensex climbed 2.30% on 12 Jun 2026, yet Ellenbarrie Industrial Gases Ltd outpaced both the benchmark and its sector, surging 7.58% to an intraday high of Rs 277.55. This 3.95-percentage-point outperformance signals a stock-specific strength that demands a closer look at the underlying technical and market context.
Read full news article
Ellenbarrie Industrial Gases Ltd Surges 7.22% to Day's High of Rs 270.7 — Outperforms Sector by 6.42 Percentage Points
The Sensex edged up a modest 0.07% on 4 Jun 2026, while Ellenbarrie Industrial Gases Ltd surged 7.22%, reaching an intraday high of Rs 270.7. This 6.42 percentage-point outperformance over its sector highlights a distinctly stock-specific rally that rewrites the short-term narrative for this small-cap chemical player.
Read full news article Announcements
Announcement under Regulation 30 (LODR)-Earnings Call Transcript
26-May-2026 | Source : BSEEllenbarrie Industrial Gases Limited has informed the exchange regarding Earnings Call Transcript for the Analysts/Investors call held on May 25 2026.
Announcement under Regulation 30 (LODR)-Analyst / Investor Meet - Outcome
25-May-2026 | Source : BSEEllenbarrie Industrial Gases Limited has informed the exchange regarding Link of Recording for analysts/investors earnings call held on Monday May 25 2026 at 04:00 PM
Announcement under Regulation 30 (LODR)-Investor Presentation
24-May-2026 | Source : BSEEllenbarrie Industrial Gases Limited has informed about investor presentation
Corporate Actions

No Upcoming Board Meetings

Ellenbarrie Industrial Gases Ltd has declared 5% dividend, ex-date: 17 Sep 12

No Splits history available

No Bonus history available

No Rights history available
Quality key factors
Valuation key factors
Technicals key factors
 Technical Indicator Scale: Bearish, Mildly Bearish, Sideways, Mildly Bullish, Bullish Turned
 Shareholding Snapshot : Mar 2026
Shareholding Compare (%holding)
Promoters
None
Held by 9 Schemes (10.59%)
Held by 9 FIIs (1.31%)
Padam Kumar Agarwala (48.84%)
Motilal Oswal Nifty Microcap 250 Index Fund (6.78%)
5.43%
Quarterly Results Snapshot (Standalone) - Mar'26 - QoQ

QoQ Growth in quarter ended Mar 2026 is 7.47% vs -8.77% in Dec 2025
QoQ Growth in quarter ended Mar 2026 is -12.30% vs -28.95% in Dec 2025
Half Yearly Results Snapshot (Standalone) - Sep'25
Not Applicable: The company has declared_date for only one period
Not Applicable: The company has declared_date for only one period
Nine Monthly Results Snapshot (Standalone) - Dec'25
Not Applicable: The company has declared_date for only one period
Not Applicable: The company has declared_date for only one period
Annual Results Snapshot (Standalone) - Mar'26

YoY Growth in year ended Mar 2026 is 9.31% vs 15.96% in Mar 2025
YoY Growth in year ended Mar 2026 is 25.35% vs 83.90% in Mar 2025
About Ellenbarrie Industrial Gases Ltd

Company Coordinates


