Entero Healthcar

INR
1,121.50
15.2 (1.37%)
BSENSE

Jan 30

BSE+NSE Vol: 33.85 k

  • Price Points
  • Score
  • Mojo Parameters
  • Total Return
  • News and Corporate Actions
  • Key factors
  • Shareholding
  • Financials
  • CompanyCV
stock-summaryPrice Point
High/Low

1Day

52 Week

Valuation
Technical
Day's Volume

CASH

33.85 k (-24.13%) Volume

Shareholding (Dec 2025)

FII

5.14%

Held by 63 FIIs

DII

6.17%

Held by 11 DIIs

Promoter

52.42%

When is the next results date for Entero Healthcar?

06-Jun-2025

No Upcoming Board Meetings

Has Entero Healthcar declared dividend?

06-Jun-2025

No Dividend History Available

Who are the peers of the Entero Healthcar?

16-Jul-2025

Entero Healthcare's peers include A B Lifestyle, Medplus Health, Aditya Vision, Khemani Distrib., M K Exim India, Purple United, Osia Hyper Retail, Purv Flexi, and Silgo Retail. Entero Healthcare shows average management risk and good growth, with a 1-year return of 4.75%, lower than Medplus Health's 38.34% but higher than Aditya Vision's -19.70%.

Peers: The peers of Entero Healthcar are A B Lifestyle, Medplus Health, Aditya Vision, Khemani Distrib., M K Exim India, Purple United, Osia Hyper Reta., Purv Flexi, and Silgo Retail.<BR><BR>Quality Snapshot: Excellent management risk is observed at Aditya Vision, Khemani Distrib., M K Exim India, and Purple United, while Average management risk is found at Entero Healthcar and the rest. Good growth is noted at Medplus Health, Aditya Vision, Khemani Distrib., M K Exim India, Purple United, and Osia Hyper Reta., while Entero Healthcar shows excellent growth and the rest have below average growth. For capital structure, excellent ratings are seen at Khemani Distrib. and M K Exim India, good at Entero Healthcar, and the rest have below average ratings.<BR><BR>Return Snapshot: Medplus Health has the highest 1-year return at 38.34%, while Aditya Vision has the lowest at -19.70%. Entero Healthcar's 1-year return is 4.75%, which is higher than Aditya Vision's but lower than Medplus Health's. Additionally, Khemani Distrib. is the only peer with a positive six-month return, while the rest have negative returns.

View full answer

What does Entero Healthcar do?

17-Jul-2025

Entero Healthcare Solutions Ltd is a mid-cap retail company, incorporated in 2018, with recent net sales of ₹13,391 Cr and a net profit of ₹257 Cr for the quarter ending March 2025. Key financial metrics include a P/E ratio of 55.00 and a market cap of ₹5,468 Cr.

Overview:<BR>Entero Healthcare Solutions Ltd operates in the retailing industry and is categorized as a mid-cap company.<BR><BR>History:<BR>The company was incorporated in 2018 as Entero Healthcare Solutions Private Limited and later converted into a public limited company, changing its name to Entero Healthcare Solutions Ltd. The latest quarterly results report net sales and net profit for the period ending March 2025.<BR><BR>Financial Snapshot:<BR>Most recent Net Sales: 13,391 Cr (Quarterly Results - Mar 2025) <BR>Most recent Net Profit: 257 Cr (Quarterly Results - Mar 2025) <BR>Market-cap value: INR 5,468 Cr (Mid Cap)<BR><BR>Key Metrics:<BR>P/E: 55.00 <BR>Industry P/E: 29 <BR>Dividend Yield: 0.00% <BR>Debt-Equity: 0.04 <BR>Return on Equity: 5.50% <BR>Price to Book: 3.15 <BR><BR>Contact Details:<BR>Registrar Address: Not available. <BR>Phone: N/A <BR>Email: N/A <BR>Website: N/A

View full answer

Who are the top shareholders of the Entero Healthcar?

17-Jul-2025

The top shareholders of Entero Healthcare include Orbimed Asia III Mauritius Limited with 38.01%, 70 foreign institutional investors holding 19.92%, and Surbhi Singh of the Prasid Uno Family Trust with 10.46%. Additionally, mutual funds hold 6.09%, while individual investors own 5.41% of the company.

The top shareholders of Entero Healthcare include several key players. The majority of the shares are held by promoters, with Orbimed Asia III Mauritius Limited being the largest individual promoter, holding 38.01%. Additionally, there are 70 foreign institutional investors (FIIs) collectively holding 19.92% of the shares. Mutual funds have a presence as well, with 7 schemes holding 6.09%. Among public shareholders, Surbhi Singh, representing the Prasid Uno Family Trust, is the largest, holding 10.46%. Individual investors collectively own 5.41% of the company.

View full answer

How big is Entero Healthcar?

24-Jul-2025

As of 24th July, Entero Healthcare Solutions Ltd has a market capitalization of 5,220.00 Cr, with net sales of 5,095.79 Cr and a net profit of 94.83 Cr reported for the latest four quarters. The company also has shareholder's funds of 1,638.06 Cr and total assets of 2,325.95 Cr for the annual period ending March 2024.

As of 24th July, Entero Healthcare Solutions Ltd has a market capitalization of 5,220.00 Cr, categorizing it as a Mid Cap company.<BR><BR>In the latest four quarters, Entero Healthcare reported net sales of 5,095.79 Cr and a net profit of 94.83 Cr.<BR><BR>For the latest annual period ending March 2024, the company reported shareholder's funds of 1,638.06 Cr and total assets of 2,325.95 Cr.

View full answer

Are Entero Healthcar latest results good or bad?

09-Aug-2025

Entero Healthcare Solutions reported strong quarterly results with a Profit After Tax of Rs 27.80 crore and net sales of Rs 1,403.82 crore, both at five-quarter highs. However, a decrease in the company's score and a 'Sell' recommendation indicate potential caution despite the positive performance.

Entero Healthcare Solutions has reported a generally positive performance for the quarter ending June 2025. The company achieved a Profit After Tax (PAT) of Rs 27.80 crore, which is the highest in the last five quarters, indicating consistent growth. Net sales also reached a peak of Rs 1,403.82 crore, reflecting a 4.84% increase compared to the previous quarter. Additionally, the Operating Profit Before Depreciation, Interest, and Taxes (PBDIT) was Rs 50.07 crore, marking another high for the same period.<BR><BR>Earnings per Share (EPS) improved to Rs 6.39, again the best figure in five quarters, showcasing the company's ability to generate higher earnings for its shareholders. However, despite these positive indicators, the company's overall score has decreased from 17 to 15 over the past three months, and MarketsMOJO has issued a 'Sell' call on the stock.<BR><BR>In summary, while the financial results indicate growth and improved profitability, the decrease in the company's score and the 'Sell' recommendation suggest some caution moving forward.

View full answer

How has been the historical performance of Entero Healthcar?

15-Nov-2025

Entero Healthcar has shown significant growth over the past five years, with net sales increasing from 1,779.74 Cr in March 2021 to 5,095.78 Cr in March 2025, and profit after tax turning positive at 107.43 Cr. The company has improved its operating profit and total assets while achieving a net cash inflow from investing activities in March 2025.

Answer:<BR>The historical performance of Entero Healthcar shows significant growth over the past five years, particularly in net sales and profitability.<BR><BR>Breakdown:<BR>Entero Healthcar's net sales have increased from 1,779.74 Cr in March 2021 to 5,095.78 Cr in March 2025, reflecting a strong upward trend. Total operating income has followed a similar trajectory, rising from 1,779.74 Cr to 5,095.78 Cr during the same period. The company's total expenditure, excluding depreciation, has also grown, reaching 4,924.23 Cr in March 2025, up from 1,758.19 Cr in March 2021. Operating profit, excluding other income, has improved significantly, moving from 21.55 Cr in March 2021 to 171.55 Cr in March 2025. This growth in operating profit has contributed to a profit before tax of 138.74 Cr in March 2025, a substantial increase from the losses recorded in previous years. The profit after tax has turned positive, reaching 107.43 Cr in March 2025, compared to losses in earlier years. The company's total assets have increased from 748.97 Cr in March 2020 to 2,688.21 Cr in March 2025, while total liabilities have also risen, from 748.97 Cr to 2,688.21 Cr. Cash flow from operating activities has shown negative trends, but cash flow from investing activities has turned positive in March 2025, indicating a net cash inflow of 81.00 Cr. Overall, Entero Healthcar has demonstrated a remarkable recovery and growth in its financial performance over the past five years.

View full answer

Is Entero Healthcar overvalued or undervalued?

17-Nov-2025

As of November 14, 2025, Entero Healthcare is considered very attractive and undervalued with a PE ratio of 44.13 and a PEG ratio of 0.31, despite a challenging year-to-date return of -20.6%, indicating strong growth potential compared to its peers.

As of 14 November 2025, Entero Healthcare has moved from an attractive to a very attractive valuation grade. The company is currently considered undervalued, with a PE ratio of 44.13, an EV to EBITDA of 23.43, and a PEG ratio of 0.31, indicating strong growth potential relative to its price. <BR><BR>In comparison to its peers, Entero's PE ratio significantly exceeds that of TCS at 22.34 and Infosys at 22.19, while its EV to EBITDA is higher than TCS's 15.7 but lower than that of LTI Mindtree at 23.98. Despite a challenging year with a year-to-date return of -20.6% compared to the Sensex's 8.22%, Entero Healthcare's strong valuation metrics suggest it remains an attractive investment opportunity in the retailing sector.

View full answer

Is Entero Healthcar technically bullish or bearish?

20-Nov-2025

As of November 19, 2025, Entero Healthcare's technical trend is bearish with moderate strength, indicated by bearish MACD, Bollinger Bands, moving averages, and KST, despite mixed signals from Dow Theory.

As of 19 November 2025, the technical trend has changed from mildly bearish to bearish. The current stance is bearish with moderate strength. Key indicators driving this include a bearish MACD on the weekly timeframe, bearish signals from Bollinger Bands on both weekly and monthly timeframes, and bearish moving averages on the daily timeframe. Additionally, the KST is bearish on the weekly, and the OBV shows a mildly bearish trend on the monthly. The Dow Theory reflects a mildly bullish stance on the weekly but is mildly bearish on the monthly, indicating mixed signals. Overall, the prevailing bearish indicators suggest a negative outlook for Entero Healthcare.

View full answer

Should I buy, sell or hold Entero Healthcare Solutions Ltd?

02-Jan-2026

Why is Entero Healthcare Solutions Ltd falling/rising?

29-Jan-2026

As of 28-Jan, Entero Healthcare Solutions Ltd's stock price is rising to 1,137.80, reflecting a 6.0 (0.53%) increase after a trend reversal. The company shows strong financial performance with a low Debt to EBITDA ratio, impressive net sales growth, and high institutional holdings, making it attractive to investors.

As of 28-Jan, Entero Healthcare Solutions Ltd's stock price is rising, currently at 1,137.80, reflecting an increase of 6.0 (0.53%). This upward movement follows a trend reversal after two consecutive days of decline. The stock has shown a strong performance over the past month, gaining 19.47%, while the benchmark Sensex has decreased by 3.17% during the same period. <BR><BR>Despite today's performance indicating a slight underperformance against its sector by 0.8%, the overall positive financial indicators contribute to the stock's rise. The company has demonstrated a robust ability to service its debt, evidenced by a low Debt to EBITDA ratio of 1.33 times. Furthermore, Entero Healthcare Solutions has reported impressive growth in net sales at an annual rate of 30.10% and a significant operating profit increase of 127.38%. <BR><BR>The company has consistently declared positive results for the last seven consecutive quarters, with net sales reaching a record high of Rs 1,570.95 crore and an operating profit to net sales ratio of 3.95%. Additionally, the stock is trading at a discount compared to its peers' average historical valuations, which enhances its attractiveness to investors. <BR><BR>The high institutional holdings at 21.56% suggest confidence from more knowledgeable investors, further supporting the stock's upward trajectory. Overall, the combination of strong financial performance, positive growth indicators, and institutional support contributes to the rising stock price of Entero Healthcare Solutions Ltd.

View full answer
iScoreScore
Click here to find our call on this stock
Strong Sell
Sell
Hold
Buy
Strong Buy

MarketsMojo — Loved in India, Now Global

The power of Mojo is now in 29 countries. Explore global equities with the same cutting-edge features you love.

Dashboard

1

Strong ability to service debt as the company has a low Debt to EBITDA ratio of 1.33 times

 
2

Healthy long term growth as Net Sales has grown by an annual rate of 30.10% and Operating profit at 127.38%

 
3

The company has declared Positive results for the last 7 consecutive quarters

4

With ROCE of 8.6, it has a Very Attractive valuation with a 2.5 Enterprise value to Capital Employed

5

High Institutional Holdings at 21.56%

6

Underperformed the market in the last 1 year

stock-summaryMojo Parameters

Mojo Parameters

Loading Valuation Snapshot...

Stock DNA

stock-summary
Industry

Retailing

stock-summary
Market cap

INR 4,880 Cr (Small Cap)

stock-summary
P/E

43.00

stock-summary
Industry P/E

27

stock-summary
Dividend Yield

0.00%

stock-summary
Debt Equity

0.16

stock-summary
Return on Equity

6.26%

stock-summary
Price to Book

2.72

Revenue and Profits:
Net Sales:
1,571 Cr
(Quarterly Results - Sep 2025)
Net Profit:
32 Cr
stock-summaryTotal Returns
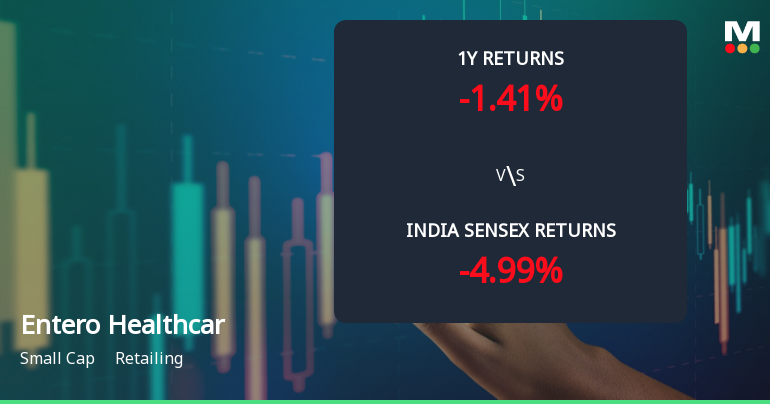
Total Returns (Price + Dividend) stock-summary
Dividend Yield (0%)
TimePeriod
Price Return
Dividend Return
Total Return
3 Months
1.22%
0%
1.22%
6 Months
-14.13%
0%
-14.13%
1 Year
-16.72%
0%
-16.72%
2 Years
0%
0%
0.0%
3 Years
0%
0%
0.0%
4 Years
0%
0%
0.0%
5 Years
0%
0%
0.0%

Entero Healthcar for the last several years.

Risk Adjusted Returns v/s stock-summary
Returns Beta
Icon
Beta has not been calculated since enough price history is not available
stock-summaryNews & Corporate Actions

News

Why is Entero Healthcare Solutions Ltd falling/rising?

Recent Price Performance and Market Context

Entero Healthcare Solutions has seen a notable divergence in its short- and long-term returns compared to the broader Sensex benchmark. Over the past week, the stock has declined by 6.37%, underperforming the Sensex, which gained 0.31% in the same period. This recent weakness is compounded by a four-day consecutive fall, with the stock touching an intraday low of ₹1,079.20, representing a 3.87% drop within the day. The weighted average price indicates that a larger volume of shares traded closer to this low, signalling selling pressure among investors.

Despite this short-term weakness, the stock has delivered a robust one-month return of 16.08%, significantly outperforming the Sensex’s 2.51% decline. Year-to-date, the stock r...

Read full news article
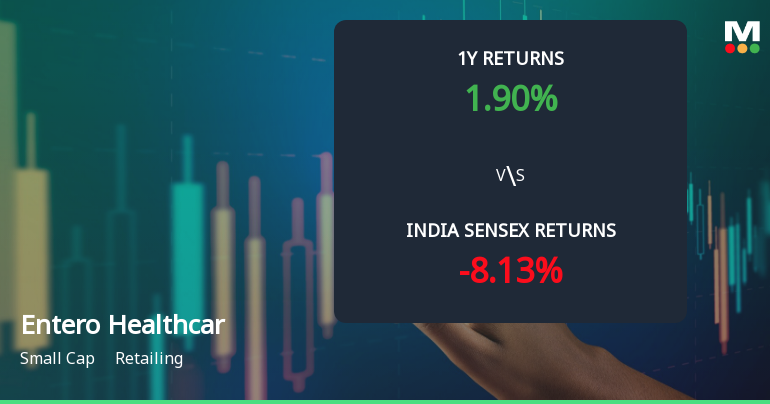
Announcements stock-summary

Icon
No announcement available

Corporate Actions stock-summary

stock-summary
BOARD MEETING

No Upcoming Board Meetings

stock-summary
DIVIDEND

No Dividend history available

stock-summary
SPLITS

No Splits history available

stock-summary
BONUS

No Bonus history available

stock-summary
RIGHTS

No Rights history available

stock-summaryKey Factors

Quality key factors stock-summary

Factor
Value
Sales Growth (5y)
30.10%
EBIT Growth (5y)
127.38%
EBIT to Interest (avg)
2.37
Debt to EBITDA (avg)
2.77
Net Debt to Equity (avg)
0.16
Sales to Capital Employed (avg)
2.16
Tax Ratio
19.00%
Dividend Payout Ratio
0
Pledged Shares
0
Institutional Holding
21.56%
ROCE (avg)
7.06%
ROE (avg)
6.26%

Valuation key factors

Factor
Value
P/E Ratio
43
Industry P/E
27
Price to Book Value
2.72
EV to EBIT
28.89
EV to EBITDA
24.06
EV to Capital Employed
2.48
EV to Sales
0.90
PEG Ratio
0.30
Dividend Yield
NA
ROCE (Latest)
8.59%
ROE (Latest)
6.26%

Technicals key factors

Indicator
Weekly
Monthly
MACD
Mildly Bullish
RSI
No Signal
No Signal
Bollinger Bands
Mildly Bullish
Mildly Bearish
Moving Averages
Mildly Bearish (Daily)
KST
Mildly Bullish
Dow Theory
Mildly Bearish
Mildly Bullish
OBV
Mildly Bearish
No Trend
stock-summary Technical Indicator Scale: Bearish, Mildly Bearish, Sideways, Mildly Bullish, Bullish  Turned 
stock-summaryShareholding
Shareholding Snapshot : Dec 2025stock-summary
Shareholding Compare (%holding) stock-summary
Majority shareholders

Promoters

Pledged Promoter Holdings

None

Mutual Funds

Held by 8 Schemes (10.25%)

FIIs

Held by 63 FIIs (5.14%)

Promoter with highest holding

Orbimed Asia Iii Mauritius Limited (38.01%)

Highest Public shareholder

Icici Prudential Value Fund (5.01%)

Individual Investors Holdings

11.56%

stock-summaryFinancial
[
  {
    "link": "quarterly",
    "btn_text": "All Quarterly Results",
    "header": "Quarterly Results Snapshot (Consolidated) - Sep'25 - QoQ",
    "rhs": [
      {
        "prefix": "Net Sales ",
        "suffix": "QoQ Growth in quarter ended Sep 2025 is 11.91% vs 4.84% in Jun 2025",
        "dir": 1
      },
      {
        "prefix": "Consolidated Net Profit ",
        "suffix": "QoQ Growth in quarter ended Sep 2025 is 13.67% vs 8.21% in Jun 2025",
        "dir": 1
      }
    ],
    "table": {
      "header": [
        "Sep'25",
        "Jun'25",
        "Change(%)"
      ],
      "body": [
        {
          "field": "Net Sales",
          "val1": "1,570.95",
          "val2": "1,403.82",
          "chgp": "11.91%",
          "chgp_class": "positive"
        },
        {
          "field": "Operating Profit (PBDIT) excl Other Income",
          "val1": "62.06",
          "val2": "50.07",
          "chgp": "23.95%",
          "chgp_class": "positive"
        },
        {
          "field": "Interest",
          "val1": "12.40",
          "val2": "10.66",
          "chgp": "16.32%",
          "chgp_class": "negative"
        },
        {
          "field": "Exceptional Items",
          "val1": "0.00",
          "val2": "0.00",
          "chgp": "",
          "chgp_class": "neutral"
        },
        {
          "field": "Consolidate Net Profit",
          "val1": "31.60",
          "val2": "27.80",
          "chgp": "13.67%",
          "chgp_class": "positive"
        },
        {
          "field": "Operating Profit Margin (Excl OI)",
          "val1": "3.95%",
          "val2": "3.57%",
          "chgp": "0.38%",
          "chgp_class": "positive"
        }
      ]
    }
  },
  {
    "link": "half-yearly",
    "btn_text": "All Half Yearly Results",
    "header": "Half Yearly Results Snapshot (Consolidated) - Sep'25",
    "rhs": [
      {
        "prefix": "Net Sales ",
        "suffix": " Growth in half year ended Sep 2025 is 24.07% vs 26.50% in Sep 2024",
        "dir": -1
      },
      {
        "prefix": "Consolidated Net Profit ",
        "suffix": " Growth in half year ended Sep 2025 is 35.93% vs 284.34% in Sep 2024",
        "dir": -1
      }
    ],
    "table": {
      "header": [
        "Sep'25",
        "Sep'24",
        "Change(%)"
      ],
      "body": [
        {
          "field": "Net Sales",
          "val1": "2,974.77",
          "val2": "2,397.73",
          "chgp": "24.07%",
          "chgp_class": "positive"
        },
        {
          "field": "Operating Profit (PBDIT) excl Other Income",
          "val1": "112.14",
          "val2": "72.62",
          "chgp": "54.42%",
          "chgp_class": "positive"
        },
        {
          "field": "Interest",
          "val1": "23.06",
          "val2": "21.16",
          "chgp": "8.98%",
          "chgp_class": "negative"
        },
        {
          "field": "Exceptional Items",
          "val1": "0.00",
          "val2": "0.00",
          "chgp": "",
          "chgp_class": "neutral"
        },
        {
          "field": "Consolidate Net Profit",
          "val1": "59.40",
          "val2": "43.70",
          "chgp": "35.93%",
          "chgp_class": "positive"
        },
        {
          "field": "Operating Profit Margin (Excl OI)",
          "val1": "3.77%",
          "val2": "3.03%",
          "chgp": "0.74%",
          "chgp_class": "positive"
        }
      ]
    }
  },
  {
    "link": "nine-monthly",
    "btn_text": "All Nine Monthly Results",
    "header": "Nine Monthly Results Snapshot (Consolidated) - Dec'24",
    "rhs": [
      {
        "prefix": "Net Sales ",
        "suffix": "YoY Growth in nine months ended Dec 2024 is 30.07% vs -8.46% in Dec 2023",
        "dir": 1
      },
      {
        "prefix": "Consolidated Net Profit ",
        "suffix": "YoY Growth in nine months ended Dec 2024 is 280.94% vs -11.25% in Dec 2023",
        "dir": 1
      }
    ],
    "table": {
      "header": [
        "Dec'24",
        "Dec'23",
        "Change(%)"
      ],
      "body": [
        {
          "field": "Net Sales",
          "val1": "3,756.73",
          "val2": "2,888.13",
          "chgp": "30.07%",
          "chgp_class": "positive"
        },
        {
          "field": "Operating Profit (PBDIT) excl Other Income",
          "val1": "122.64",
          "val2": "82.96",
          "chgp": "47.83%",
          "chgp_class": "positive"
        },
        {
          "field": "Interest",
          "val1": "31.13",
          "val2": "48.36",
          "chgp": "-35.63%",
          "chgp_class": "positive"
        },
        {
          "field": "Exceptional Items",
          "val1": "0.00",
          "val2": "0.00",
          "chgp": "",
          "chgp_class": "neutral"
        },
        {
          "field": "Consolidate Net Profit",
          "val1": "69.14",
          "val2": "18.15",
          "chgp": "280.94%",
          "chgp_class": "positive"
        },
        {
          "field": "Operating Profit Margin (Excl OI)",
          "val1": "3.26%",
          "val2": "2.87%",
          "chgp": "0.39%",
          "chgp_class": "positive"
        }
      ]
    }
  },
  {
    "link": "annual",
    "btn_text": "All Annual Results",
    "header": "Annual Results Snapshot (Consolidated) - Mar'25",
    "rhs": [
      {
        "prefix": "Net Sales ",
        "suffix": "YoY Growth in year ended Mar 2025 is 29.92% vs 18.85% in Mar 2024",
        "dir": 1
      },
      {
        "prefix": "Consolidated Net Profit ",
        "suffix": "YoY Growth in year ended Mar 2025 is 142.44% vs 438.32% in Mar 2024",
        "dir": -1
      }
    ],
    "table": {
      "header": [
        "Mar'25",
        "Mar'24",
        "Change(%)"
      ],
      "body": [
        {
          "field": "Net Sales",
          "val1": "5,095.78",
          "val2": "3,922.31",
          "chgp": "29.92%",
          "chgp_class": "positive"
        },
        {
          "field": "Operating Profit (PBDIT) excl Other Income",
          "val1": "171.55",
          "val2": "111.85",
          "chgp": "53.38%",
          "chgp_class": "positive"
        },
        {
          "field": "Interest",
          "val1": "41.62",
          "val2": "65.68",
          "chgp": "-36.63%",
          "chgp_class": "positive"
        },
        {
          "field": "Exceptional Items",
          "val1": "0.00",
          "val2": "0.00",
          "chgp": "",
          "chgp_class": "neutral"
        },
        {
          "field": "Consolidate Net Profit",
          "val1": "94.82",
          "val2": "39.11",
          "chgp": "142.44%",
          "chgp_class": "positive"
        },
        {
          "field": "Operating Profit Margin (Excl OI)",
          "val1": "3.37%",
          "val2": "2.85%",
          "chgp": "0.52%",
          "chgp_class": "positive"
        }
      ]
    }
  }
]

Quarterly Results Snapshot (Consolidated) - Sep'25 - QoQstock-summary

Sep'25
Jun'25
Change(%)
Net Sales
1,570.95
1,403.82
11.91%
Operating Profit (PBDIT) excl Other Income
62.06
50.07
23.95%
Interest
12.40
10.66
16.32%
Exceptional Items
0.00
0.00
Consolidate Net Profit
31.60
27.80
13.67%
Operating Profit Margin (Excl OI)
3.95%
3.57%
0.38%
Values in Rs Cr.
Direction Arrows
Net Sales

QoQ Growth in quarter ended Sep 2025 is 11.91% vs 4.84% in Jun 2025

Direction Arrows
Consolidated Net Profit

QoQ Growth in quarter ended Sep 2025 is 13.67% vs 8.21% in Jun 2025

Half Yearly Results Snapshot (Consolidated) - Sep'25stock-summary

Sep'25
Sep'24
Change(%)
Net Sales
2,974.77
2,397.73
24.07%
Operating Profit (PBDIT) excl Other Income
112.14
72.62
54.42%
Interest
23.06
21.16
8.98%
Exceptional Items
0.00
0.00
Consolidate Net Profit
59.40
43.70
35.93%
Operating Profit Margin (Excl OI)
3.77%
3.03%
0.74%
Values in Rs Cr.
Direction Arrows
Net Sales

Growth in half year ended Sep 2025 is 24.07% vs 26.50% in Sep 2024

Direction Arrows
Consolidated Net Profit

Growth in half year ended Sep 2025 is 35.93% vs 284.34% in Sep 2024

Nine Monthly Results Snapshot (Consolidated) - Dec'24stock-summary

Dec'24
Dec'23
Change(%)
Net Sales
3,756.73
2,888.13
30.07%
Operating Profit (PBDIT) excl Other Income
122.64
82.96
47.83%
Interest
31.13
48.36
-35.63%
Exceptional Items
0.00
0.00
Consolidate Net Profit
69.14
18.15
280.94%
Operating Profit Margin (Excl OI)
3.26%
2.87%
0.39%
Values in Rs Cr.
Direction Arrows
Net Sales

YoY Growth in nine months ended Dec 2024 is 30.07% vs -8.46% in Dec 2023

Direction Arrows
Consolidated Net Profit

YoY Growth in nine months ended Dec 2024 is 280.94% vs -11.25% in Dec 2023

Annual Results Snapshot (Consolidated) - Mar'25stock-summary

Mar'25
Mar'24
Change(%)
Net Sales
5,095.78
3,922.31
29.92%
Operating Profit (PBDIT) excl Other Income
171.55
111.85
53.38%
Interest
41.62
65.68
-36.63%
Exceptional Items
0.00
0.00
Consolidate Net Profit
94.82
39.11
142.44%
Operating Profit Margin (Excl OI)
3.37%
2.85%
0.52%
Values in Rs Cr.
Direction Arrows
Net Sales

YoY Growth in year ended Mar 2025 is 29.92% vs 18.85% in Mar 2024

Direction Arrows
Consolidated Net Profit

YoY Growth in year ended Mar 2025 is 142.44% vs 438.32% in Mar 2024

stock-summaryCompany CV
About Entero Healthcare Solutions Ltd stock-summary
stock-summary
Entero Healthcare Solutions Ltd
Small Cap
Retailing
Entero Healthcare Solutions Limited was incorporated as `Entero Healthcare Solutions Private Limited' dated January 10, 2018, issued by the Registrar of Companies, Central Registration Centre, at New Delhi. Subsequently, the Company was converted into a public limited company and the name of the Company was changed to `Entero Healthcare Solutions Limited', and a fresh certificate of incorporation dated August 25, 2023, was issued by the RoC.
Company Coordinates stock-summary
Icon
No Company Details Available