
Compare Medplus Health with Similar Stocks
Dashboard
Poor Management Efficiency with a low ROCE of 7.36%
- The company has been able to generate a Return on Capital Employed (avg) of 7.36% signifying low profitability per unit of total capital (equity and debt)
Company's ability to service its debt is weak with a poor EBIT to Interest (avg) ratio of 1.93
60.74% of Promoter Shares are Pledged
Below par performance in long term as well as near term
Total Returns (Price + Dividend) 
Medplus Health for the last several years.
Risk Adjusted Returns v/s
Returns Beta

News

Medplus Health Services Ltd Technical Momentum Shifts Amid Mixed Market Signals
Medplus Health Services Ltd has experienced a notable shift in its technical momentum, transitioning from a mildly bearish stance to a sideways trend. Despite a recent downgrade in its Mojo Grade to Sell, the stock’s technical indicators present a complex picture, reflecting both cautious optimism and persistent bearish undertones in the retailing sector.
Read full news article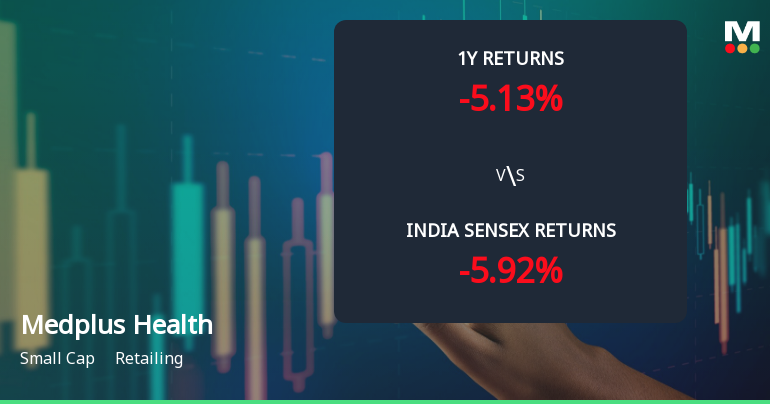
Medplus Health Services Ltd Faces Mildly Bearish Technical Shift Amid Mixed Momentum
Medplus Health Services Ltd, a small-cap player in the retailing sector, has experienced a subtle shift in its technical momentum, moving from a sideways trend to a mildly bearish stance. Recent technical indicators, including MACD, Bollinger Bands, and moving averages, suggest a cautious outlook for investors as the stock navigates a challenging market environment.
Read full news article
Medplus Health Services Ltd Technical Momentum Shifts to Sideways; Hold Rating Upgraded
Medplus Health Services Ltd has exhibited a notable shift in its technical momentum, moving from a mildly bearish stance to a more neutral sideways trend. This transition is underscored by mixed signals from key technical indicators such as MACD, RSI, and moving averages, reflecting a cautious market sentiment despite a modest price uptick.
Read full news article Announcements
Corporate Actions

21 Jul 2026

No Dividend history available

No Splits history available

No Bonus history available

No Rights history available
Quality key factors
Valuation key factors
Technicals key factors
 Technical Indicator Scale: Bearish, Mildly Bearish, Sideways, Mildly Bullish, Bullish Turned
 Shareholding Snapshot : Mar 2026
Shareholding Compare (%holding)
Promoters
60.7445
Held by 17 Schemes (22.6%)
Held by 146 FIIs (15.53%)
Lone Furrow Investments Private Limited (14.39%)
Nippon Life India Trustee Ltd-a/c Nippon India Mul (7.54%)
11.82%
Quarterly Results Snapshot (Consolidated) - Mar'26 - QoQ

QoQ Growth in quarter ended Mar 2026 is 3.23% vs 7.55% in Dec 2025

QoQ Growth in quarter ended Mar 2026 is 10.67% vs 4.16% in Dec 2025
Half Yearly Results Snapshot (Consolidated) - Sep'25
Growth in half year ended Sep 2025 is 5.12% vs 13.82% in Sep 2024
Growth in half year ended Sep 2025 is 84.29% vs 189.37% in Sep 2024
Nine Monthly Results Snapshot (Consolidated) - Dec'25
YoY Growth in nine months ended Dec 2025 is 8.68% vs 11.90% in Dec 2024
YoY Growth in nine months ended Dec 2025 is 57.26% vs 208.57% in Dec 2024
Annual Results Snapshot (Consolidated) - Mar'26
YoY Growth in year ended Mar 2026 is 12.33% vs 9.09% in Mar 2025
YoY Growth in year ended Mar 2026 is 46.12% vs 129.60% in Mar 2025
About Medplus Health Services Ltd

Company Coordinates


