
Compare Aditya Vision with Similar Stocks
Dashboard
High Management Efficiency with a high ROCE of 19.80%
Healthy long term growth as Net Sales has grown by an annual rate of 29.00% and Operating profit at 31.36%
Flat results in Mar 26
With ROCE of 16.6, it has a Expensive valuation with a 7.6 Enterprise value to Capital Employed
High Institutional Holdings at 35.76%
Market Beating Performance
Total Returns (Price + Dividend) 
Latest dividend: 1.1 per share ex-dividend date: Jul-08-2025
Risk Adjusted Returns v/s
Returns Beta

News

Aditya Vision Ltd Technical Momentum Shifts Amid Mixed Indicator Signals
Aditya Vision Ltd, a small-cap player in the retailing sector, has experienced a nuanced shift in its technical momentum, moving from a bullish to a mildly bullish stance. Despite a marginal day change of -0.01%, the stock’s technical indicators present a complex picture, with some signals pointing to strength while others suggest caution. This article analyses the recent technical parameter changes, key momentum indicators, and their implications for investors.
Read full news article
Aditya Vision Ltd is Rated Hold by MarketsMOJO
Aditya Vision Ltd is rated 'Hold' by MarketsMOJO, with this rating last updated on 09 May 2026. However, the analysis and financial metrics discussed here reflect the stock's current position as of 11 July 2026, providing investors with the latest insights into the company’s performance and outlook.
Read full news article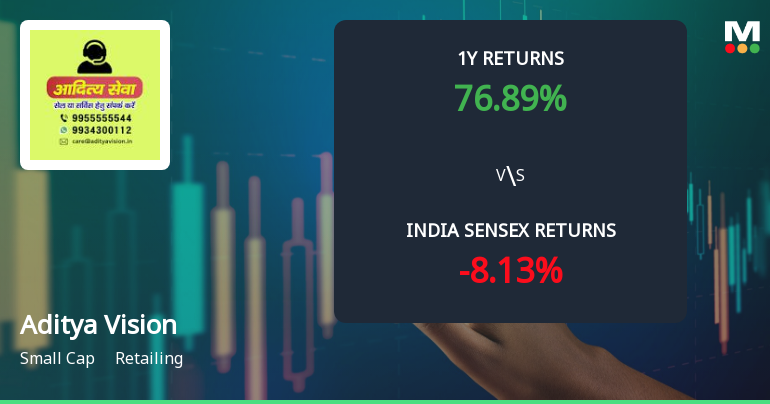
Aditya Vision Ltd Technical Momentum Shifts Signal Bullish Outlook Amid Mixed Indicators
Aditya Vision Ltd, a small-cap player in the retailing sector, has experienced a notable shift in its technical momentum, moving from a mildly bullish stance to a more confident bullish trend. Despite a slight dip in the stock price on 10 Jul 2026, the technical indicators present a nuanced picture, with some signals pointing to strength while others suggest caution. This article analyses the recent technical parameter changes, key momentum indicators, and the stock’s performance relative to the broader market.
Read full news article Announcements
Corporate Actions

No Upcoming Board Meetings

Aditya Vision Ltd has declared 110% dividend, ex-date: 08 Jul 25

Aditya Vision Ltd has announced 1:10 stock split, ex-date: 27 Aug 24

No Bonus history available

No Rights history available
Quality key factors
Valuation key factors
Technicals key factors
 Technical Indicator Scale: Bearish, Mildly Bearish, Sideways, Mildly Bullish, Bullish Turned
 Shareholding Snapshot : Mar 2026
Shareholding Compare (%holding)
Promoters
None
Held by 12 Schemes (18.97%)
Held by 77 FIIs (16.18%)
Yashovardhan Sinha (27.38%)
Hdfc Small Cap Fund (7.52%)
15.81%
Quarterly Results Snapshot (Standalone) - Mar'26 - YoY

YoY Growth in quarter ended Mar 2026 is 28.42% vs 29.55% in Mar 2025
YoY Growth in quarter ended Mar 2026 is 35.98% vs 103.57% in Mar 2025
Half Yearly Results Snapshot (Standalone) - Sep'25
Growth in half year ended Sep 2025 is 10.52% vs 32.51% in Sep 2024
Growth in half year ended Sep 2025 is 3.95% vs 38.77% in Sep 2024
Nine Monthly Results Snapshot (Standalone) - Dec'25
YoY Growth in nine months ended Dec 2025 is 15.43% vs 29.65% in Dec 2024
YoY Growth in nine months ended Dec 2025 is 6.33% vs 29.31% in Dec 2024
Annual Results Snapshot (Standalone) - Mar'26
YoY Growth in year ended Mar 2026 is 18.23% vs 29.63% in Mar 2025
YoY Growth in year ended Mar 2026 is 10.84% vs 36.88% in Mar 2025
About Aditya Vision Ltd

Company Coordinates


