
Compare Enviro Infra with Similar Stocks
Dashboard
Company has a Debt to Equity ratio (avg) of 0.01 times
Poor long term growth as Operating profit has grown by an annual rate 17.26% of over the last 5 years
Flat results in Mar 26
With ROE of 15.4, it has a Expensive valuation with a 3.3 Price to Book Value
Despite the size of the company, domestic mutual funds hold only 0.3% of the company
Stock DNA
Other Utilities
INR 4,019 Cr (Small Cap)
21.00
39
0.00%
0.02
15.38%
3.27
Total Returns (Price + Dividend) 
Enviro Infra for the last several years.
Risk Adjusted Returns v/s
Returns Beta

News
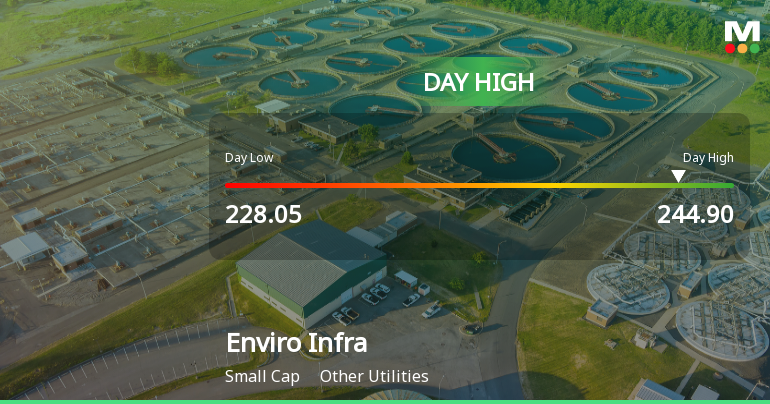
Enviro Infra Engineers Ltd Surges 7.01% to Day's High of Rs 244.9 — Outperforms Sector by 5.81 Percentage Points
The Sensex advanced 1.08% on 10 Jul 2026, yet Enviro Infra Engineers Ltd outpaced the broader market with a 7.01% gain, touching an intraday high of Rs 244.9. This 5.81-percentage-point outperformance over its sector signals a distinctly stock-specific momentum shift rather than a mere market tailwind.
Read full news article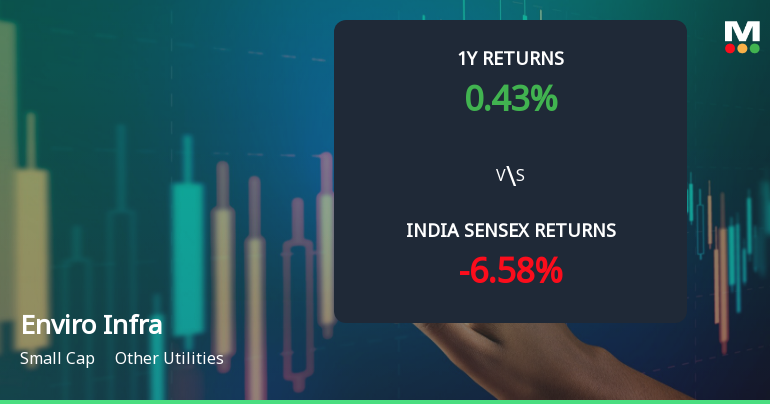
Enviro Infra Engineers Ltd Technical Momentum Shifts Signal Bullish Outlook
Enviro Infra Engineers Ltd has witnessed a notable shift in its technical momentum, reflected in a recent upgrade of its MarketsMOJO grade from Sell to Hold on 22 June 2026. The stock’s price action and technical indicators suggest a strengthening bullish trend, supported by positive signals across multiple timeframes and metrics, positioning it favourably within the Other Utilities sector.
Read full news article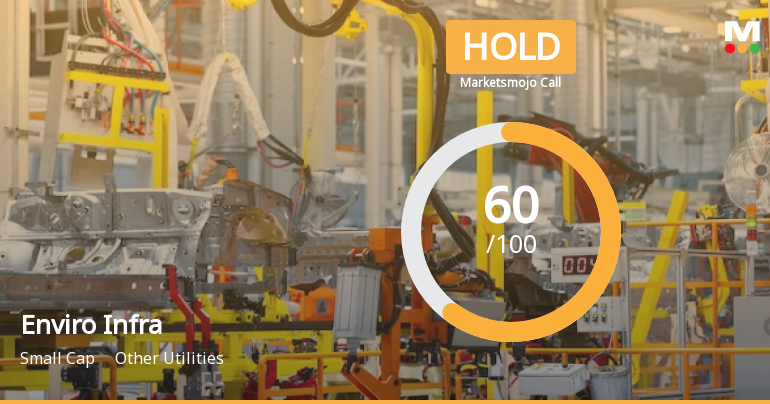
Enviro Infra Engineers Ltd is Rated Hold
Enviro Infra Engineers Ltd is rated 'Hold' by MarketsMOJO, with this rating last updated on 22 June 2026. While the rating change occurred on that date, the analysis and financial metrics discussed here reflect the stock's current position as of 05 July 2026, providing investors with the most up-to-date view of the company’s fundamentals and market performance.
Read full news article Announcements
Corporate Actions

No Upcoming Board Meetings

No Dividend history available

No Splits history available

No Bonus history available

No Rights history available
Quality key factors
Valuation key factors
Technicals key factors
 Technical Indicator Scale: Bearish, Mildly Bearish, Sideways, Mildly Bullish, Bullish Turned
 Shareholding Snapshot : Mar 2026
Shareholding Compare (%holding)
Promoters
None
Held by 5 Schemes (0.09%)
Held by 16 FIIs (0.58%)
Sanjay Jain (27.88%)
None
24.73%
Quarterly Results Snapshot (Consolidated) - Mar'26 - QoQ

QoQ Growth in quarter ended Mar 2026 is 70.91% vs 9.97% in Dec 2025
QoQ Growth in quarter ended Mar 2026 is 28.48% vs -17.06% in Dec 2025
Half Yearly Results Snapshot (Consolidated) - Sep'25

Growth in half year ended Sep 2025 is 11.98% vs 50.09% in Sep 2024
Growth in half year ended Sep 2025 is 36.54% vs 101.40% in Sep 2024
Nine Monthly Results Snapshot (Consolidated) - Dec'25
YoY Growth in nine months ended Dec 2025 is 7.91% vs 55.32% in Dec 2024
YoY Growth in nine months ended Dec 2025 is 27.13% vs 102.63% in Dec 2024
Annual Results Snapshot (Consolidated) - Mar'26
YoY Growth in year ended Mar 2026 is 7.46% vs 46.25% in Mar 2025
YoY Growth in year ended Mar 2026 is 3.77% vs 62.59% in Mar 2025
About Enviro Infra Engineers Ltd

Company Coordinates


