
Compare EMS with Similar Stocks
Dashboard
Poor long term growth as Net Sales has grown by an annual rate of -3.86% and Operating profit at -18.78% over the last 5 years
With a fall in Operating Profit of -35.74%, the company declared Very Negative results in Mar 26
With ROE of 8.6, it has a Very Expensive valuation with a 2.2 Price to Book Value
Despite the size of the company, domestic mutual funds hold only 0.01% of the company
Underperformed the market in the last 1 year
Stock DNA
Other Utilities
INR 2,544 Cr (Small Cap)
26.00
36
0.36%
0.09
8.58%
2.20
Total Returns (Price + Dividend) 
Latest dividend: 1.4989554317548748 per share ex-dividend date: Sep-19-2025
Risk Adjusted Returns v/s
Returns Beta

News
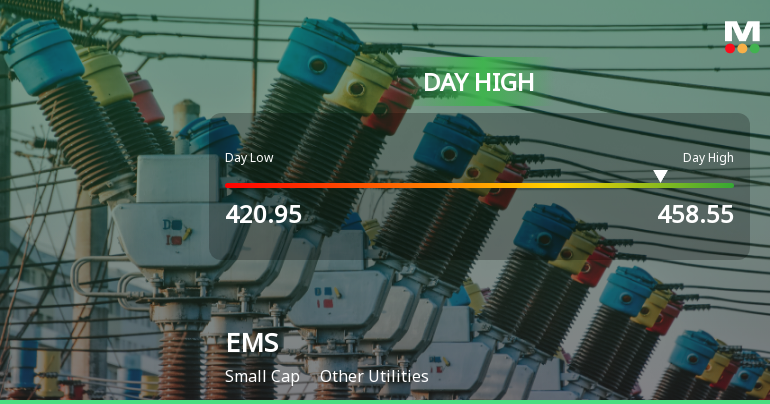
EMS Ltd Surges 8.04% to Day's High of Rs 456.5 — Outperforms Sector by 8.16 Percentage Points
The Sensex advanced 1.09% on 10 Jul 2026, yet EMS Ltd outpaced the broader market with an 8.04% gain, outperforming its sector by 8.16 percentage points. This sharp single-session surge rewrites the short-term narrative for the Other Utilities small-cap, raising the question of whether this is a breakout or a continuation of recent momentum.
Read full news article
EMS Ltd Upgraded to Sell as Technicals Improve Despite Weak Financials
EMS Ltd has seen its investment rating upgraded from Strong Sell to Sell as of 9 July 2026, reflecting a nuanced shift in its technical outlook despite persistent financial challenges. The company’s technical indicators have improved from mildly bearish to sideways, prompting a reassessment of its near-term prospects, even as fundamental weaknesses remain a concern.
Read full news article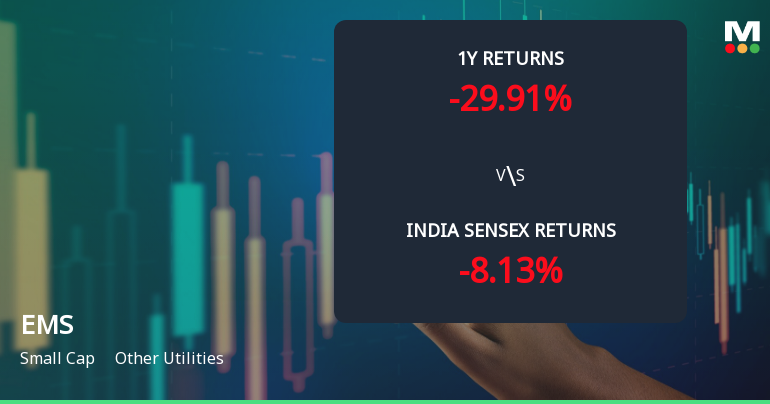
EMS Ltd Technical Momentum Shifts Amid Mixed Indicator Signals
EMS Ltd has exhibited a notable shift in its technical momentum, moving from a mildly bearish stance to a sideways trend, reflecting a complex interplay of bullish and bearish signals across key indicators. Despite a 2.32% gain on 10 Jul 2026, the stock remains under pressure from its broader downtrend, with technical parameters offering a nuanced outlook for investors navigating the Other Utilities sector.
Read full news article Announcements
Corporate Actions

No Upcoming Board Meetings

EMS Ltd has declared 15% dividend, ex-date: 19 Sep 25

No Splits history available

No Bonus history available

No Rights history available
Quality key factors
Valuation key factors
Technicals key factors
 Technical Indicator Scale: Bearish, Mildly Bearish, Sideways, Mildly Bullish, Bullish Turned
 Shareholding Snapshot : Jun 2026
Shareholding Compare (%holding)
Promoters
21.9452
Held by 1 Schemes (0.0%)
Held by 5 FIIs (0.14%)
Ramveer Singh (67.85%)
None
26.27%
Quarterly Results Snapshot (Consolidated) - Mar'26 - QoQ

QoQ Growth in quarter ended Mar 2026 is -39.86% vs 15.49% in Dec 2025
QoQ Growth in quarter ended Mar 2026 is -70.31% vs -33.32% in Dec 2025
Half Yearly Results Snapshot (Consolidated) - Sep'25
Growth in half year ended Sep 2025 is -6.46% vs 26.19% in Sep 2024
Growth in half year ended Sep 2025 is -23.80% vs 27.70% in Sep 2024
Nine Monthly Results Snapshot (Consolidated) - Dec'25
YoY Growth in nine months ended Dec 2025 is -10.70% vs 25.00% in Dec 2024
YoY Growth in nine months ended Dec 2025 is -38.11% vs 30.39% in Dec 2024
Annual Results Snapshot (Consolidated) - Mar'26
YoY Growth in year ended Mar 2026 is -24.65% vs 22.59% in Mar 2025
YoY Growth in year ended Mar 2026 is -50.68% vs 20.45% in Mar 2025
About EMS Ltd

Company Coordinates


