
Compare Ethos with Similar Stocks
Stock DNA
Gems, Jewellery And Watches
INR 6,462 Cr (Small Cap)
68.00
43
0.00%
-0.23
6.49%
4.43
Total Returns (Price + Dividend) 
Ethos for the last several years.
Risk Adjusted Returns v/s
Returns Beta

News

Ethos Ltd is Rated Sell by MarketsMOJO
Ethos Ltd is rated Sell by MarketsMOJO, with this rating last updated on 13 May 2026. However, the analysis and financial metrics discussed here reflect the stock’s current position as of 19 June 2026, providing investors with the most up-to-date perspective on the company’s performance and outlook.
Read full news article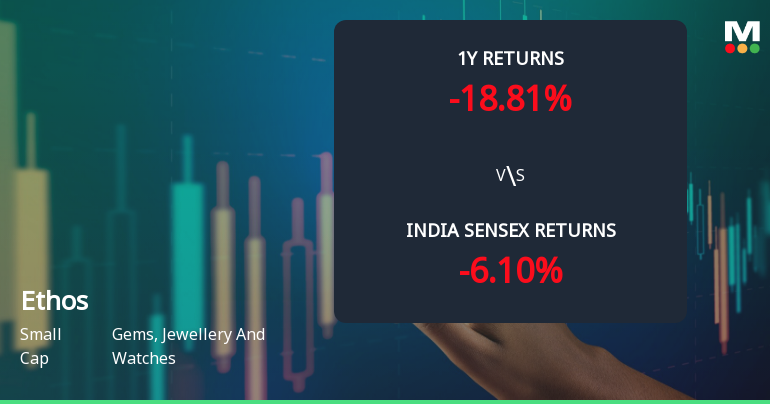
Ethos Ltd Technical Momentum Shifts Amid Mixed Indicator Signals
Ethos Ltd, a small-cap player in the Gems, Jewellery and Watches sector, has experienced a notable shift in its technical momentum, reflecting a complex interplay of bullish and bearish signals across multiple timeframes. Despite a recent downgrade in its Mojo Grade to Sell from Strong Sell, the stock’s price action and technical indicators suggest a nuanced outlook that investors should carefully analyse.
Read full news article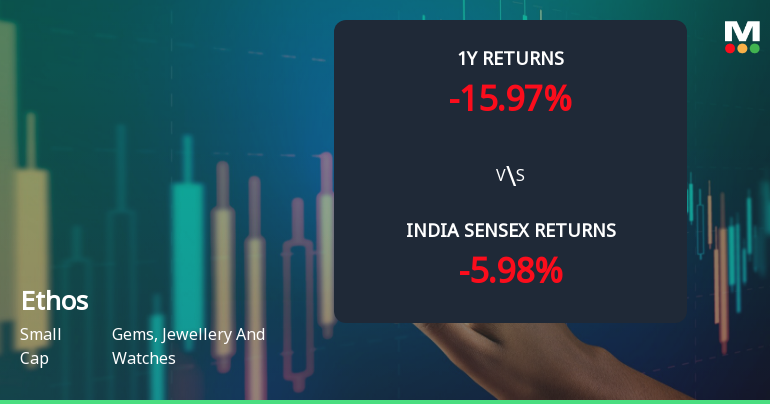
Ethos Ltd Technical Momentum Shifts Amid Mixed Market Signals
Ethos Ltd, a small-cap player in the Gems, Jewellery and Watches sector, has exhibited a notable shift in its technical momentum, moving from a mildly bearish stance to a sideways trend. Despite a recent 2.85% gain in the stock price, the technical indicators present a complex picture, with mixed signals from MACD, RSI, moving averages, and other momentum oscillators, reflecting cautious investor sentiment amid broader market challenges.
Read full news article Announcements
Disclosure Under Regulation 30 Of The SEBI (Listing Obligations And Disclosure Requirements) Regulations 2015
05-Jun-2026 | Source : BSEDisclosure under Regulation 30 of SEBI (LODR) Regulations 2015
Opening Of Ethos Watch Boutiques At Indira Gandhi International Airport Delhi
04-Jun-2026 | Source : BSEOpening of Ethos Watch Boutiques at Indira Gandhi International Airport Delhi
Announcement under Regulation 30 (LODR)-Newspaper Publication
03-Jun-2026 | Source : BSENewspaper Publication of Notice of Postal Ballot
Corporate Actions

No Upcoming Board Meetings

No Dividend history available

No Splits history available

No Bonus history available

Ethos Ltd has announced 4:43 rights issue, ex-date: 12 Jun 25
Quality key factors
Valuation key factors
Technicals key factors
 Technical Indicator Scale: Bearish, Mildly Bearish, Sideways, Mildly Bullish, Bullish Turned
 Shareholding Snapshot : Mar 2026
Shareholding Compare (%holding)
Promoters
None
Held by 13 Schemes (20.16%)
Held by 64 FIIs (10.89%)
Kddl Limited (43.07%)
Icici Prudential Esg Exclusionary Strategy Fund (8.04%)
10.41%
Quarterly Results Snapshot (Consolidated) - Mar'26 - QoQ

QoQ Growth in quarter ended Mar 2026 is -11.63% vs 22.20% in Dec 2025
QoQ Growth in quarter ended Mar 2026 is -27.70% vs 27.91% in Dec 2025
Half Yearly Results Snapshot (Consolidated) - Sep'25

Growth in half year ended Sep 2025 is 27.93% vs 22.60% in Sep 2024
Growth in half year ended Sep 2025 is -2.81% vs 19.86% in Sep 2024
Nine Monthly Results Snapshot (Consolidated) - Dec'25
YoY Growth in nine months ended Dec 2025 is 27.43% vs 25.97% in Dec 2024
YoY Growth in nine months ended Dec 2025 is -0.41% vs 18.10% in Dec 2024
Annual Results Snapshot (Consolidated) - Mar'26
YoY Growth in year ended Mar 2026 is 28.81% vs 25.29% in Mar 2025
YoY Growth in year ended Mar 2026 is -1.58% vs 15.61% in Mar 2025
About Ethos Ltd

Company Coordinates


