
Compare Exato Technologi with Similar Stocks
Dashboard
High Management Efficiency with a high ROCE of 0%
The company is Net-Debt Free
Healthy long term growth as Operating profit has grown by an annual rate 0%
Flat results in Mar 26
With ROE of 18.1, it has a Fair valuation with a 6.7 Price to Book Value
Falling Participation by Institutional Investors
Stock DNA
Computers - Software & Consulting
INR 595 Cr (Micro Cap)
31.00
21
0.00%
-0.21
18.11%
6.49
Total Returns (Price + Dividend) 
Exato Technologi for the last several years.
Risk Adjusted Returns v/s
Returns Beta

News

Exato Technologies Ltd Sees Technical Momentum Shift Amid Strong Price Gains
Exato Technologies Ltd, a micro-cap player in the Computers - Software & Consulting sector, has experienced a notable shift in its technical momentum, moving from a bullish to a mildly bullish stance. This transition is underscored by mixed signals from key technical indicators such as MACD, RSI, and moving averages, reflecting a nuanced outlook for investors amid strong recent price gains.
Read full news article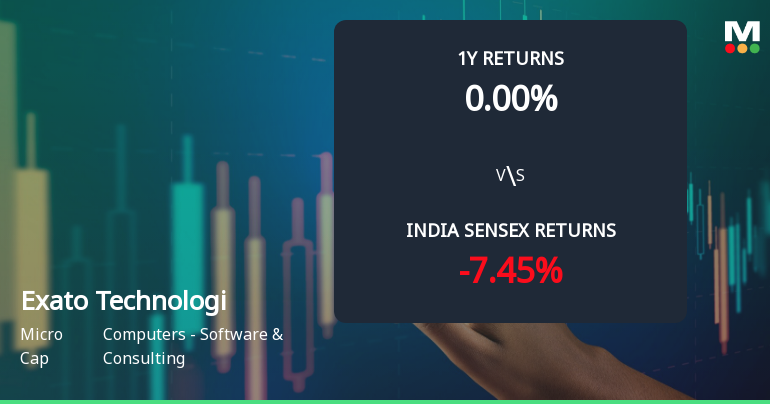
Exato Technologies Ltd Sees Bullish Momentum Shift Amid Strong Monthly Returns
Exato Technologies Ltd, a micro-cap player in the Computers - Software & Consulting sector, has experienced a notable shift in its technical momentum, moving from a mildly bullish stance to a more confident bullish trend. This change is underscored by improvements in key technical indicators such as the MACD, Bollinger Bands, and Dow Theory signals, signalling renewed investor interest and potential upside in the stock’s price trajectory.
Read full news article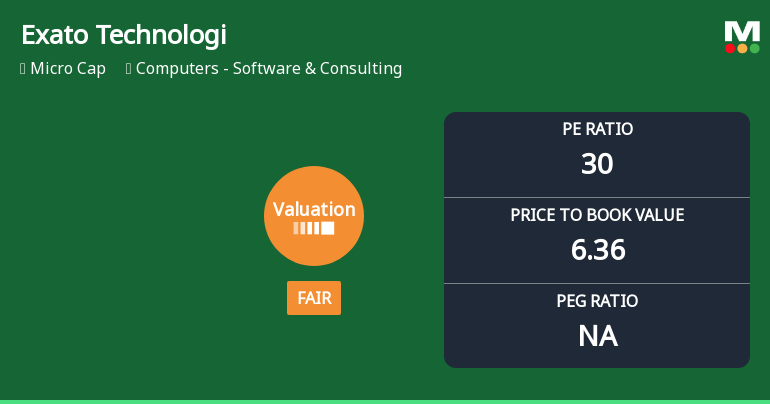
Exato Technologies Ltd Valuation Shifts to Fair Amid Strong Market Returns
Exato Technologies Ltd, a micro-cap player in the Computers - Software & Consulting sector, has experienced a notable shift in its valuation parameters, moving from an attractive to a fair rating. This change reflects evolving market perceptions amid strong company fundamentals and sector-wide valuation trends, prompting a reassessment of its price attractiveness relative to peers and historical benchmarks.
Read full news article Announcements
Disclosure Under Regulation 30 Of The SEBI (Listing Obligations And Disclosure Requirements) Regulations 2015 - Partnership Under The Hewlett Packard Enterprise (HPE) Partner Ready Program
21-Jul-2026 | Source : BSEDisclosure under Regulation 30 of the SEBI (Listing Obligations and Disclosure Requirements) Regulations 2015 - Partnership under the Hewlett Packard Enterprise (HPE) Partner Ready Program
Clarification On Price Movement In The Equity Shares Of Exato Technologies Limited
14-Jul-2026 | Source : BSEClarification on price movement in the Equity Shares of Exato Technologies Limited
Announcement under Regulation 30 (LODR)-Memorandum of Understanding /Agreements
14-Jul-2026 | Source : BSEDisclosure under Regulation 30 of the SEBI (LODR) Regulations 2015 - Execution of Partnership Agreement by Wholly Owned Subsidiary
Corporate Actions

No Upcoming Board Meetings

No Dividend history available

No Splits history available

No Bonus history available

No Rights history available
Quality key factors
Valuation key factors
Technicals key factors
 Technical Indicator Scale: Bearish, Mildly Bearish, Sideways, Mildly Bullish, Bullish Turned
 Shareholding Snapshot : Mar 2026
Shareholding Compare (%holding)
Promoters
None
Held by 0 Schemes
Held by 0 FIIs
Appuorv K Sinha (53.98%)
Nine Alps Trust-nine Alps Opportunity Fund (6.83%)
24.97%
Quarterly Results Snapshot (Standalone) - Mar'26 - QoQ

QoQ Growth in quarter ended Mar 2026 is 74.93% vs -17.23% in Dec 2025
QoQ Growth in quarter ended Mar 2026 is -0.23% vs -4.39% in Dec 2025
Half Yearly Results Snapshot (Standalone) - Mar'26
Not Applicable: The company has declared_date for only one period
Not Applicable: The company has declared_date for only one period
Nine Monthly Results Snapshot (Consolidated) - Dec'25
Not Applicable: The company has declared_date for only one period
Not Applicable: The company has declared_date for only one period
Annual Results Snapshot (Consolidated) - Mar'26
YoY Growth in year ended Mar 2026 is 35.23% vs 9.06% in Mar 2025

YoY Growth in year ended Mar 2026 is 66.74% vs 81.73% in Mar 2025
About Exato Technologies Ltd

Company Coordinates


