
Compare Faze Three with Similar Stocks
Dashboard
Poor long term growth as Operating profit has grown by an annual rate 5.91% of over the last 5 years
With ROCE of 7.4, it has a Expensive valuation with a 2.2 Enterprise value to Capital Employed
Despite the size of the company, domestic mutual funds hold only 0% of the company
Stock DNA
Garments & Apparels
INR 1,300 Cr (Micro Cap)
37.00
23
0.00%
0.54
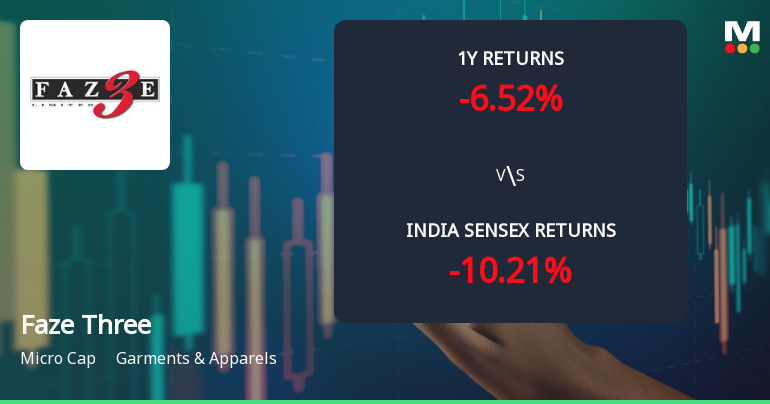
7.42%
2.91
Total Returns (Price + Dividend) 
Latest dividend: 0.5 per share ex-dividend date: Jun-06-2022
Risk Adjusted Returns v/s
Returns Beta

News
Faze Three Ltd Technical Momentum Shifts Amid Mixed Indicator Signals
Faze Three Ltd, a micro-cap player in the Garments & Apparels sector, has experienced a subtle shift in its technical momentum, reflecting a complex interplay of bullish and bearish signals across multiple timeframes. Despite a recent downgrade from Hold to Sell by MarketsMOJO, the stock’s price action and technical indicators reveal nuanced trends that merit close attention from investors navigating this volatile segment.
Read full news article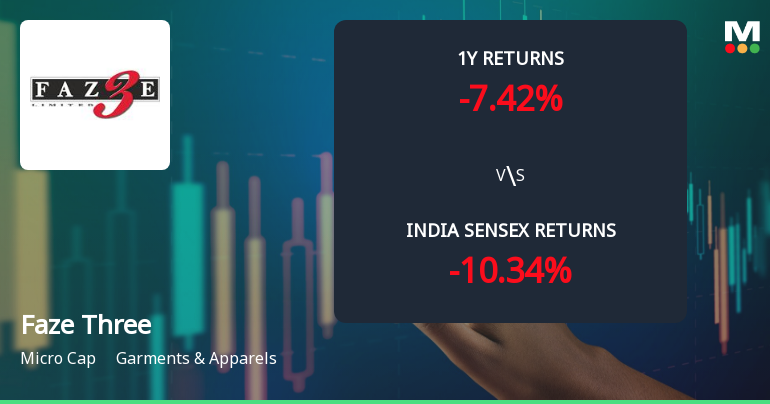
Faze Three Ltd Technical Momentum Shifts Signal Bullish Outlook Amid Micro-Cap Challenges
Faze Three Ltd, a micro-cap player in the Garments & Apparels sector, has witnessed a notable shift in its technical momentum, moving from a mildly bearish stance to a bullish trend. This change is underscored by positive signals from key technical indicators such as MACD, Bollinger Bands, and moving averages, despite mixed returns relative to the broader Sensex index. Investors and analysts are now closely monitoring these developments to assess the stock’s potential trajectory in a challenging market environment.
Read full news article
Golden Cross Confirmed: Do Faze Three Ltd's Other Technical Indicators Agree?
The 50-day moving average has crossed above the 200-day moving average for Faze Three Ltd, signalling a golden cross on 09 Jun 2026. While this technical event often suggests a shift towards bullish momentum, the broader technical and fundamental context presents a nuanced picture that merits closer examination.
Read full news article Announcements
Announcement under Regulation 30 (LODR)-Resignation of Director
10-Jun-2026 | Source : BSEThis is to inform you that Mr. Manan Shah (DIN: 07589737) Independent Director of the Company has resigned from the Board of the Company with effect from June 10 2026 vide his resignation letter dated June 10 2026. Please refer attached disclosure for further details.
Announcement under Regulation 30 (LODR)-Investor Presentation
25-May-2026 | Source : BSEPlease find the attached Companys presentation on the Audited (Standalone and Consolidated) Financial Results of the Company for the quarter and financial year ended March 31 2026.
Announcement under Regulation 30 (LODR)-Newspaper Publication
25-May-2026 | Source : BSEThis is to inform you that the Company in addition to the requisite publications in the newspapers in compliance with Regulation 47 of the SEBI Listing Regulations has also published an advertisement in Mint (English) today pertaining to the Audited Financial Results (Standalone and Consolidated) of the Company for the Quarter and Financial Year ended March 31 2026.
Corporate Actions

No Upcoming Board Meetings

Faze Three Ltd has declared 5% dividend, ex-date: 06 Jun 22

Faze Three Ltd has announced 10:2 stock split, ex-date: 24 Oct 07

No Bonus history available

No Rights history available
Quality key factors
Valuation key factors
Technicals key factors
 Technical Indicator Scale: Bearish, Mildly Bearish, Sideways, Mildly Bullish, Bullish Turned
 Shareholding Snapshot : Mar 2026
Shareholding Compare (%holding)
Promoters
None
Held by 0 Schemes
Held by 3 FIIs (0.15%)
Ajay Brijlal Anand (34.84%)
Ajay Shrikrishan Jindal (11.56%)
35.7%
Quarterly Results Snapshot (Consolidated) - Mar'26 - QoQ

QoQ Growth in quarter ended Mar 2026 is 22.14% vs 9.64% in Dec 2025

QoQ Growth in quarter ended Mar 2026 is 206.25% vs 223.08% in Dec 2025
Half Yearly Results Snapshot (Consolidated) - Sep'25
Growth in half year ended Sep 2025 is 39.09% vs 15.00% in Sep 2024
Growth in half year ended Sep 2025 is -47.32% vs -42.43% in Sep 2024
Nine Monthly Results Snapshot (Consolidated) - Dec'25
YoY Growth in nine months ended Dec 2025 is 34.73% vs 19.80% in Dec 2024
YoY Growth in nine months ended Dec 2025 is -39.89% vs -38.31% in Dec 2024
Annual Results Snapshot (Consolidated) - Mar'26
YoY Growth in year ended Mar 2026 is 33.79% vs 22.22% in Mar 2025
YoY Growth in year ended Mar 2026 is -17.44% vs -12.73% in Mar 2025
About Faze Three Ltd

Company Coordinates


