
Compare Fervent Synerg. with Similar Stocks
Dashboard
Weak Long Term Fundamental Strength with an average Return on Equity (ROE) of 2.69%
- Company's ability to service its debt is weak with a poor EBIT to Interest (avg) ratio of -1.10
Flat results in Mar 26
With ROE of 6.7, it has a Very Expensive valuation with a 1.2 Price to Book Value
Below par performance in long term as well as near term
Stock DNA
Trading & Distributors
INR 68 Cr (Micro Cap)
18.00
34
0.00%
0.01
6.68%
1.20
Total Returns (Price + Dividend) 
Fervent Synerg. for the last several years.
Risk Adjusted Returns v/s
Returns Beta

News
Fervent Synergies Ltd is Rated Strong Sell
Fervent Synergies Ltd is rated Strong Sell by MarketsMOJO. This rating was last updated on 17 Oct 2025, reflecting a significant reassessment of the stock’s outlook. However, the analysis and financial metrics presented here are based on the company’s current position as of 17 June 2026, providing investors with the latest insights into its performance and valuation.
Read full news article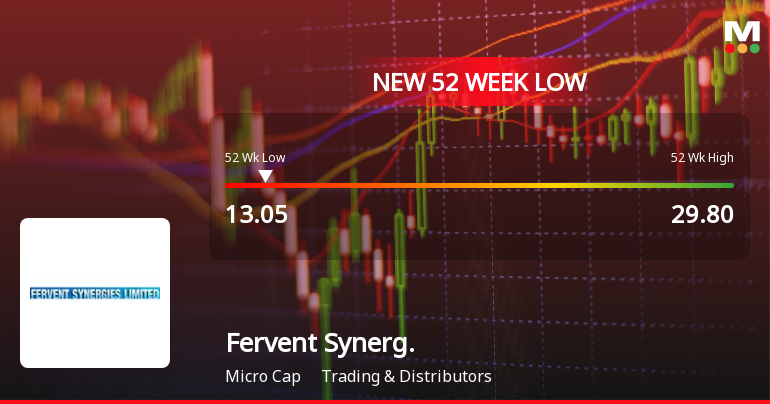
Markets Rally, But Fervent Synergies Ltd Sinks to 52-Week Low in Stock-Specific Sell-Off
While the Sensex surged by 1.43% today, Fervent Synergies Ltd slipped to a fresh 52-week low of Rs 13.05, marking a 33.96% decline over the past year and underscoring persistent pressures on this micro-cap stock.
Read full news article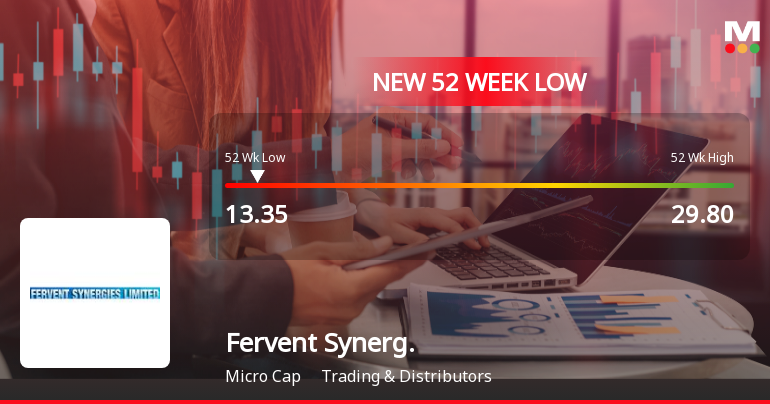
Markets Rally, But Fervent Synergies Ltd Sinks to 52-Week Low in Stock-Specific Sell-Off
Despite a broadly positive market environment, Fervent Synergies Ltd has plunged to a fresh 52-week low of Rs 13.35 on 12 Jun 2026, marking a steep decline of 8.12% on the day and extending its year-long underperformance relative to the Sensex.
Read full news article Announcements
Shareholder Meeting / Postal Ballot-Scrutinizers Report
16-May-2026 | Source : BSEas Attached
Compliances-Reg.24(A)-Annual Secretarial Compliance
15-May-2026 | Source : BSEas Attached
Board Meeting Outcome for Outcome Of Board Meeting
14-May-2026 | Source : BSEas Attached
Corporate Actions

No Upcoming Board Meetings

No Dividend history available

No Splits history available

No Bonus history available

No Rights history available
Quality key factors
Valuation key factors
Technicals key factors
 Technical Indicator Scale: Bearish, Mildly Bearish, Sideways, Mildly Bullish, Bullish Turned
 Shareholding Snapshot : Mar 2026
Shareholding Compare (%holding)
Promoters
None
Held by 0 Schemes
Held by 0 FIIs
Vijay Thakkar (62.3%)
Blue Berry Securities Pvt Ltd (4.95%)
7.44%
Quarterly Results Snapshot (Standalone) - Mar'26 - QoQ

QoQ Growth in quarter ended Mar 2026 is -46.83% vs 1,338.24% in Dec 2025
QoQ Growth in quarter ended Mar 2026 is -59.35% vs 397.67% in Dec 2025
Half Yearly Results Snapshot (Standalone) - Sep'25

Growth in half year ended Sep 2025 is 87.67% vs 15.87% in Sep 2024
Growth in half year ended Sep 2025 is 645.45% vs -42.11% in Sep 2024
Nine Monthly Results Snapshot (Standalone) - Dec'25
YoY Growth in nine months ended Dec 2025 is -58.80% vs 186.05% in Dec 2024
YoY Growth in nine months ended Dec 2025 is 20.33% vs 339.29% in Dec 2024
Annual Results Snapshot (Standalone) - Mar'26
YoY Growth in year ended Mar 2026 is -49.63% vs 33.53% in Mar 2025
YoY Growth in year ended Mar 2026 is 29.49% vs 122.98% in Mar 2025
About Fervent Synergies Ltd

Company Coordinates


