
Compare Filatex India with Similar Stocks
Stock DNA
Garments & Apparels
INR 2,240 Cr (Small Cap)
12.00
23
0.00%
-0.08
12.21%
1.48
Total Returns (Price + Dividend) 
Latest dividend: 0.2 per share ex-dividend date: Sep-19-2022
Risk Adjusted Returns v/s
Returns Beta

News

Filatex India Ltd Downgraded to Sell Amid Mixed Technicals and Flat Financials
Filatex India Ltd, a small-cap player in the Garments & Apparels sector, has seen its investment rating downgraded from Hold to Sell as of 10 June 2026. This change is primarily driven by a deterioration in technical indicators, despite an improved valuation profile and stable financial metrics. The company’s Mojo Score now stands at 42.0, reflecting a cautious stance amid mixed signals across quality, valuation, financial trends, and technical parameters.
Read full news article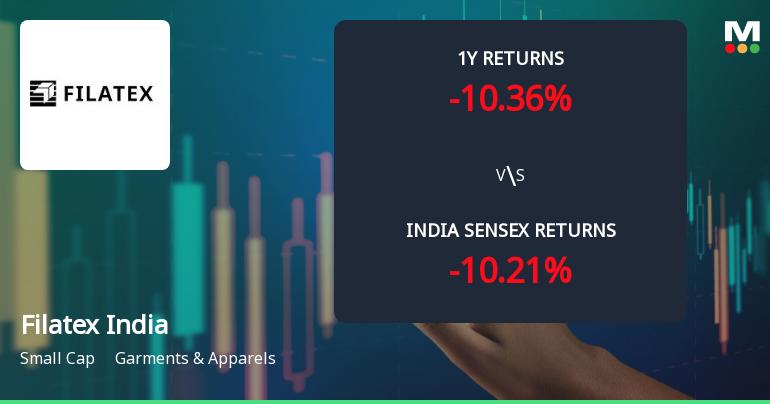
Filatex India Ltd Technical Momentum Shifts Amid Mixed Indicator Signals
Filatex India Ltd, a small-cap player in the Garments & Apparels sector, has experienced a notable shift in its technical momentum, moving from a sideways trend to a mildly bearish stance. Recent technical indicators present a complex picture, with some weekly signals showing mild bullishness while monthly trends lean bearish, reflecting a nuanced outlook for investors.
Read full news article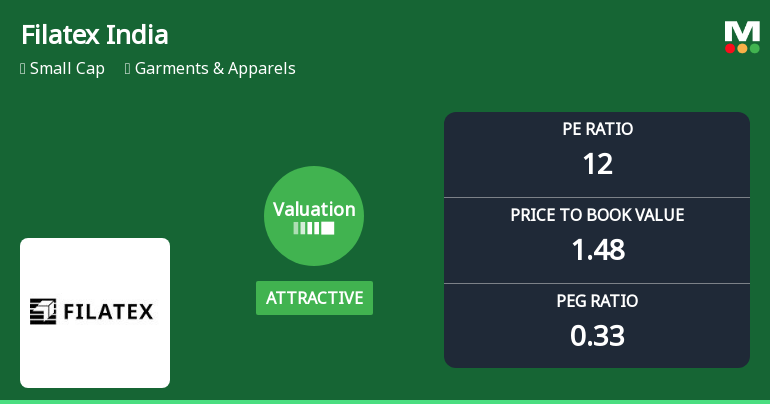
Filatex India Ltd Valuation Turns Attractive Amid Market Volatility
Filatex India Ltd, a small-cap player in the Garments & Apparels sector, has seen a notable shift in its valuation parameters, moving from fair to attractive territory. Despite a recent downgrade in its Mojo Grade to Sell, the company’s price-to-earnings (P/E) and price-to-book value (P/BV) ratios now present a compelling case for value investors seeking opportunities in the textile industry.
Read full news article Announcements
Compliances-Reg.24(A)-Annual Secretarial Compliance
28-May-2026 | Source : BSEPlease find attached annual secretarial compliance report for the financial year 2025-26.
Announcement under Regulation 30 (LODR)-Acquisition
12-May-2026 | Source : BSEPlease find attached Letter for acquisition of 10000000 Equity Shares of Ecosis Limited Wholly Owned Subsidiary Company.
Announcement under Regulation 30 (LODR)-Credit Rating
12-May-2026 | Source : BSELetter for reaffirmation of credit ratings is attached.
Corporate Actions

No Upcoming Board Meetings

Filatex India Ltd has declared 25% dividend, ex-date: 19 Sep 25

Filatex India Ltd has announced 1:2 stock split, ex-date: 27 Dec 22

No Bonus history available

No Rights history available
Quality key factors
Valuation key factors
Technicals key factors
 Technical Indicator Scale: Bearish, Mildly Bearish, Sideways, Mildly Bullish, Bullish Turned
 Shareholding Snapshot : Mar 2026
Shareholding Compare (%holding)
Promoters
None
Held by 2 Schemes (1.18%)
Held by 46 FIIs (4.23%)
Madhav Bhageria (9.7%)
Chaturbhuj Properties Llp (4.92%)
17.72%
Quarterly Results Snapshot (Standalone) - Mar'26 - QoQ

QoQ Growth in quarter ended Mar 2026 is -6.12% vs -2.44% in Dec 2025
QoQ Growth in quarter ended Mar 2026 is -27.27% vs 16.31% in Dec 2025
Half Yearly Results Snapshot (Standalone) - Sep'25

Growth in half year ended Sep 2025 is 1.04% vs -3.38% in Sep 2024
Growth in half year ended Sep 2025 is 92.99% vs 12.38% in Sep 2024
Nine Monthly Results Snapshot (Standalone) - Dec'25
YoY Growth in nine months ended Dec 2025 is 0.09% vs -2.70% in Dec 2024
YoY Growth in nine months ended Dec 2025 is 54.15% vs 22.91% in Dec 2024
Annual Results Snapshot (Consolidated) - Mar'26
Not Applicable: The company has declared_date for only one period
Not Applicable: The company has declared_date for only one period
About Filatex India Ltd

Company Coordinates


