
Compare Finkurve Fin. with Similar Stocks
Stock DNA
Non Banking Financial Company (NBFC)
INR 972 Cr (Micro Cap)
38.00
21
0.00%
1.16
7.92%
3.01
Total Returns (Price + Dividend) 
Finkurve Fin. for the last several years.
Risk Adjusted Returns v/s
Returns Beta

News
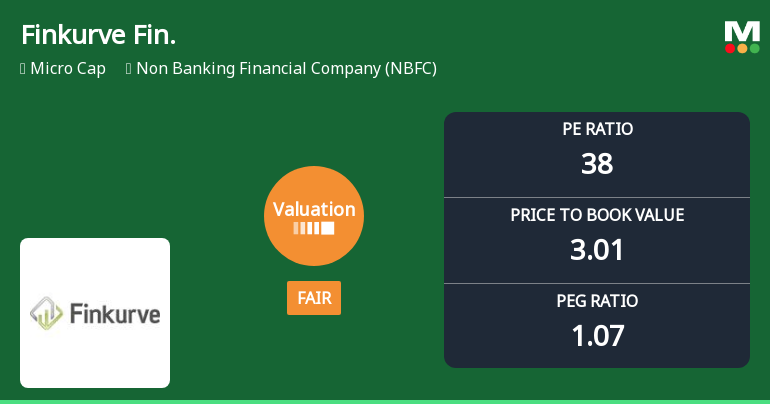
Finkurve Financial Services Ltd: Valuation Shifts Signal Changing Market Perception
Finkurve Financial Services Ltd, a micro-cap player in the Non Banking Financial Company (NBFC) sector, has experienced a notable shift in its valuation parameters, moving from an attractive to a fair valuation grade. This change reflects evolving market perceptions amid mixed financial metrics and a challenging broader market environment.
Read full news article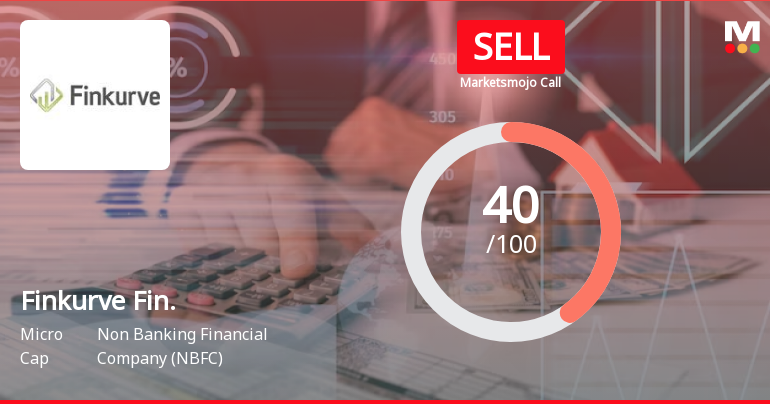
Finkurve Financial Services Ltd is Rated Sell
Finkurve Financial Services Ltd is rated 'Sell' by MarketsMOJO, with this rating last updated on 20 May 2026. However, the analysis and financial metrics discussed here reflect the stock's current position as of 21 June 2026, providing investors with the most up-to-date view of the company’s fundamentals, valuation, financial trends, and technical outlook.
Read full news article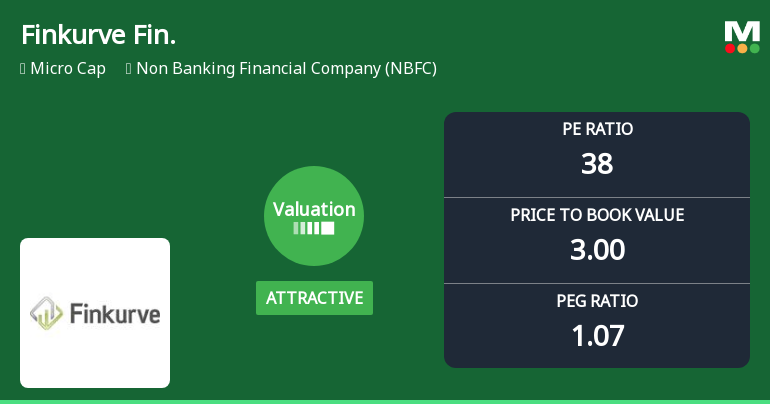
Finkurve Financial Services Ltd: Valuation Shifts Signal Renewed Price Attractiveness
Finkurve Financial Services Ltd, a micro-cap player in the Non Banking Financial Company (NBFC) sector, has witnessed a notable shift in its valuation parameters, moving from a very attractive to an attractive rating. Despite a challenging return profile relative to the Sensex, recent price movements and valuation metrics suggest a recalibration of price attractiveness that merits close investor attention.
Read full news article Announcements
Closure of Trading Window
19-Jun-2026 | Source : BSEwe would like to inform you that in compliance with the provisions of SEBI(PIT)Regulation 2015 as amended and pursuant to the Companys Insider Code of Conduct the trading window for dealing in the securities of the Company will remain closed for all designated person and their immediate relatives from July 1 2026 till the end of 48 hours after the conclusion of Board Meeting for consideration and approval of un-audited financial results of the company for the quarter ended on june 30 2026 as may be approved at the concerned Board Meeting. The date of the Board Meeting for declaration of the unaudited financial results of the Company for the quarter ended june 30 2026 will be intimated in due course.
Board Meeting Intimation for Regulations 29 And 50 Of The Securities And Exchange Board Of India (Listing Obligations And Disclosure Requirements) Regulations 2015
18-Jun-2026 | Source : BSEFinkurve Financial Services Ltdhas informed BSE that the meeting of the Board of Directors of the Company is scheduled on 24/06/2026 inter alia to consider and approve the raising of funds aggregating up to Rs. 50 Crores (Rupees Fifty Crores only) through issuance of Non-Convertible Debentures through private placement.
Board Meeting Outcome for Outcome Of Board Meeting Held On June 15 2026
15-Jun-2026 | Source : BSEThe Board Of Directors Has Inter Alia Approved The Raising Of Funds Through Issue Of Non-Convertible Debentures On Private Placement Basis.
Corporate Actions

24 Jun 2026

No Dividend history available

Finkurve Financial Services Ltd has announced 1:10 stock split, ex-date: 26 Feb 14

Finkurve Financial Services Ltd has announced 6:1 bonus issue, ex-date: 22 Aug 13

No Rights history available
Quality key factors
Valuation key factors
Technicals key factors
 Technical Indicator Scale: Bearish, Mildly Bearish, Sideways, Mildly Bullish, Bullish Turned
 Shareholding Snapshot : Mar 2026
Shareholding Compare (%holding)
Promoters
19.0427
Held by 0 Schemes
Held by 6 FIIs (7.03%)
Mohinidevi Bhanwarlal Kothari (28.92%)
Thomas John Muthoot (13.15%)
30.34%
Quarterly Results Snapshot (Standalone) - Mar'26 - QoQ

QoQ Growth in quarter ended Mar 2026 is 29.58% vs 8.14% in Dec 2025

QoQ Growth in quarter ended Mar 2026 is 15.19% vs 17.91% in Dec 2025
Half Yearly Results Snapshot (Standalone) - Sep'25
Growth in half year ended Sep 2025 is 45.75% vs 40.14% in Sep 2024
Growth in half year ended Sep 2025 is 40.08% vs 25.56% in Sep 2024
Nine Monthly Results Snapshot (Standalone) - Dec'25
YoY Growth in nine months ended Dec 2025 is 39.61% vs 50.25% in Dec 2024
YoY Growth in nine months ended Dec 2025 is 33.26% vs 20.86% in Dec 2024
Annual Results Snapshot (Standalone) - Mar'26
YoY Growth in year ended Mar 2026 is 47.51% vs 56.02% in Mar 2025
YoY Growth in year ended Mar 2026 is 49.51% vs 8.34% in Mar 2025
About Finkurve Financial Services Ltd

Company Coordinates


