
Compare Finolex Cables with Similar Stocks
Stock DNA
Cables - Electricals
INR 17,710 Cr (Small Cap)
25.00
50
0.69%
-0.33
11.73%
2.91
Total Returns (Price + Dividend) 
Latest dividend: 8 per share ex-dividend date: Sep-04-2025
Risk Adjusted Returns v/s
Returns Beta

News
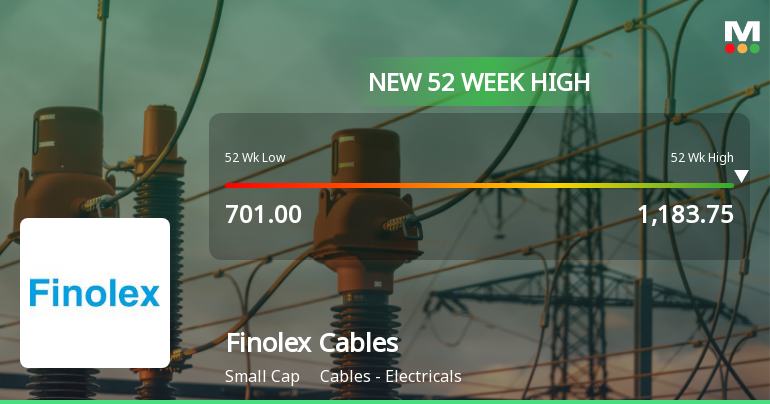
Broad-Based Technical Strength Lifts Finolex Cables Ltd. to 52-Week High of Rs 1183.75
With a sustained rally over the past eight trading sessions, Finolex Cables Ltd. has surged to within a hair’s breadth of its 52-week high, closing just 0.06% shy of Rs 1183.75 on 22 Jun 2026. This momentum is underpinned by a confluence of bullish technical indicators and a market environment that has broadly supported midcap and sectoral strength.
Read full news article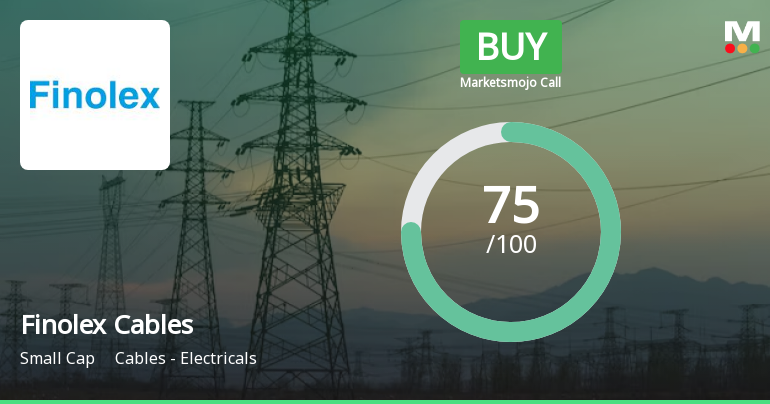
Finolex Cables Ltd. is Rated Buy
Finolex Cables Ltd. is rated 'Buy' by MarketsMOJO, with this rating last updated on 29 May 2026. However, the analysis and financial metrics discussed here reflect the company’s current position as of 19 June 2026, providing investors with the most up-to-date insights into the stock’s performance and outlook.
Read full news article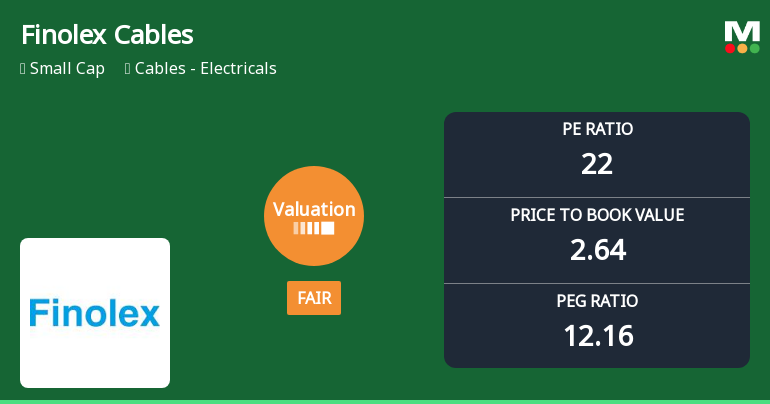
Finolex Cables Ltd: Valuation Shift Signals Fair Price Amid Strong Returns
Finolex Cables Ltd., a prominent player in the electrical cables sector, has witnessed a notable shift in its valuation parameters, moving from an attractive to a fair valuation grade. This change reflects evolving market perceptions amid robust stock performance and shifting sector dynamics, prompting investors to reassess the company’s price attractiveness relative to its historical and peer benchmarks.
Read full news article Announcements
Announcement under Regulation 30 (LODR)-Award_of_Order_Receipt_of_Order
13-Jun-2026 | Source : BSEIntimation of order received from Additional Commissioner Grade-II Appeal Lucknow Uttar Pradesh
Announcement under Regulation 30 (LODR)-Resignation of Company Secretary / Compliance Officer
12-Jun-2026 | Source : BSEResignation of Company Secretary and Compliance Officer.
Announcement under Regulation 30 (LODR)-Earnings Call Transcript
03-Jun-2026 | Source : BSETranscript of Analyst/Investors Meet held on 29th May 2026
Corporate Actions

No Upcoming Board Meetings

Finolex Cables Ltd. has declared 400% dividend, ex-date: 04 Sep 25

Finolex Cables Ltd. has announced 2:10 stock split, ex-date: 08 Jan 07

No Bonus history available

No Rights history available
Quality key factors
Valuation key factors
Technicals key factors
 Technical Indicator Scale: Bearish, Mildly Bearish, Sideways, Mildly Bullish, Bullish Turned
 Shareholding Snapshot : Mar 2026
Shareholding Compare (%holding)
Non Institution
None
Held by 28 Schemes (11.63%)
Held by 149 FIIs (9.62%)
Orbit Electricals Private Limited (30.7%)
Finolex Industries Limited (14.51%)
18.74%
Quarterly Results Snapshot (Consolidated) - Mar'26 - YoY

YoY Growth in quarter ended Mar 2026 is 22.36% vs 13.82% in Mar 2025
YoY Growth in quarter ended Mar 2026 is 17.07% vs 3.01% in Mar 2025
Half Yearly Results Snapshot (Consolidated) - Sep'25
Growth in half year ended Sep 2025 is 9.01% vs 6.29% in Sep 2024

Growth in half year ended Sep 2025 is -10.10% vs 15.00% in Sep 2024
Nine Monthly Results Snapshot (Consolidated) - Dec'25
YoY Growth in nine months ended Dec 2025 is 17.34% vs 3.07% in Dec 2024
YoY Growth in nine months ended Dec 2025 is -3.88% vs 9.34% in Dec 2024
Annual Results Snapshot (Consolidated) - Mar'26
YoY Growth in year ended Mar 2026 is 18.84% vs 6.07% in Mar 2025
YoY Growth in year ended Mar 2026 is 1.85% vs 7.53% in Mar 2025
About Finolex Cables Ltd.

Company Coordinates


