
Compare Fractal Analyt. with Similar Stocks
Stock DNA
Software Products
INR 15,528 Cr (Mid Cap)
49.00
19
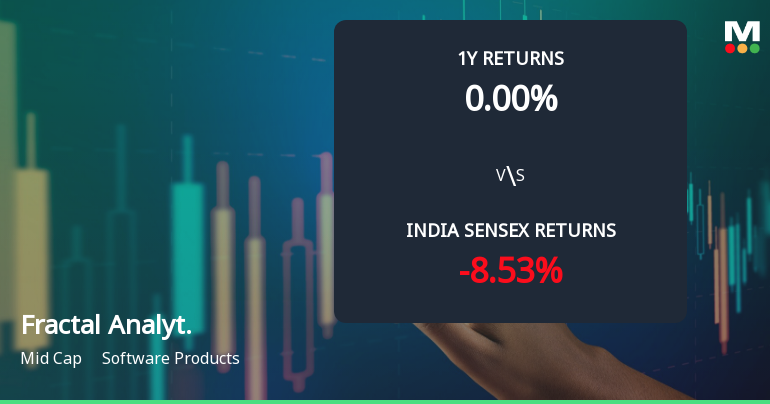
0.00%
-0.51
9.50%
4.75
Total Returns (Price + Dividend) 
Fractal Analyt. for the last several years.
Risk Adjusted Returns v/s
Returns Beta

News
Fractal Analytics Ltd Faces Mildly Bearish Momentum Amid Technical Shifts
Fractal Analytics Ltd, a mid-cap player in the Software Products sector, has experienced a subtle shift in its technical momentum, moving from a sideways trend to a mildly bearish stance. Despite a recent downgrade reversal from Sell to Hold, the stock’s technical indicators reveal a nuanced picture of price momentum and market sentiment as it navigates a challenging environment.
Read full news article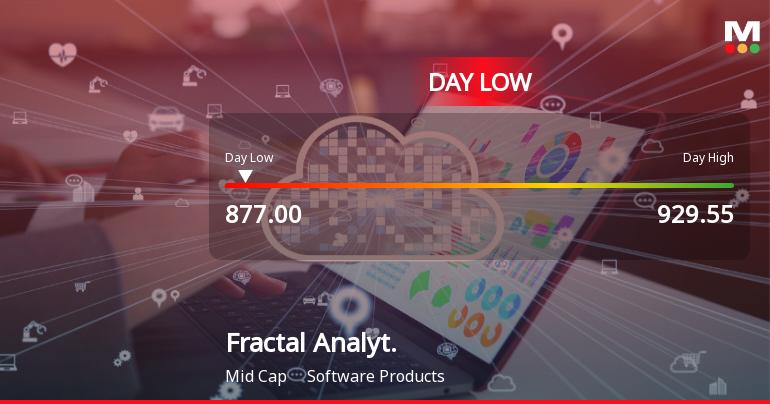
Fractal Analytics Ltd Hits Intraday Low Amid Price Pressure on 29 Jun 2026
Fractal Analytics Ltd experienced a notable intraday decline on 29 Jun 2026, touching a low of Rs 877, reflecting a 5.12% drop as the stock underperformed its sector and broader market indices amid prevailing price pressures and subdued market sentiment.
Read full news article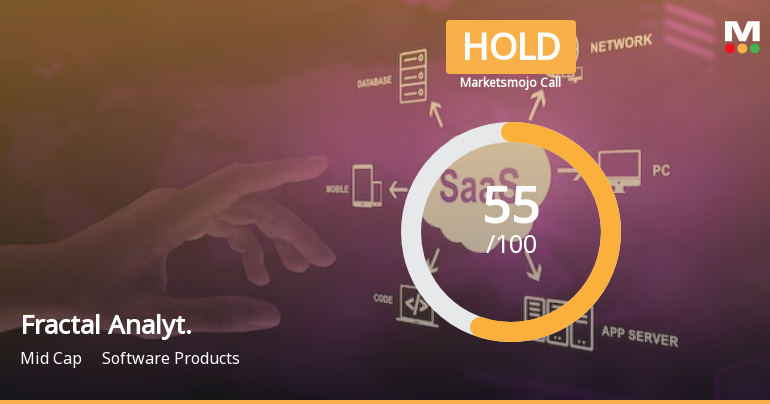
Fractal Analytics Ltd is Rated Hold
Fractal Analytics Ltd is rated 'Hold' by MarketsMOJO, with this rating last updated on 22 June 2026. While the rating change occurred on that date, the analysis and financial metrics discussed here reflect the stock's current position as of 28 June 2026, providing investors with the most up-to-date insight into the company’s performance and outlook.
Read full news article Announcements
Board Meeting Intimation for Unaudited Standalone And Consolidated Financial Results Of The Company For The Quarter Ending June 30 2026.
25-Jun-2026 | Source : BSEFractal Analytics Ltdhas informed BSE that the meeting of the Board of Directors of the Company is scheduled on 23/07/2026 inter alia to consider and approve unaudited standalone and consolidated financial results of the Company for the quarter ending June 30 2026.
Announcement under Regulation 30 (LODR)-Analyst / Investor Meet - Intimation
25-Jun-2026 | Source : BSEPursuant to Regulation 30 read with Schedule III of the SEBI (Listing Obligations and Disclosure Requirements) Regulations 2015 (as amended from time to time) we wish to inform you that a conference call (audio con-call) will be held on Friday July 24 2026 from 8:00 AM IST to 9:00 AM IST for discussing the unaudited financial results of the Company for the quarter ending June 30 2026.
Announcement under Regulation 30 (LODR)-Analyst / Investor Meet - Intimation
18-Jun-2026 | Source : BSESchedule of Analysts or Institutional Investors meet
Corporate Actions

23 Jul 2026

No Dividend history available

No Splits history available

No Bonus history available

No Rights history available
Quality key factors
Valuation key factors
Technicals key factors
 Technical Indicator Scale: Bearish, Mildly Bearish, Sideways, Mildly Bullish, Bullish Turned
 Shareholding Snapshot : Mar 2026
Shareholding Compare (%holding)
FIIs
3.4242
Held by 12 Schemes (7.95%)
Held by 38 FIIs (40.48%)
Pranay Agrawal (4.72%)
Tpg Fett Holdings Pte. Ltd. (22.27%)
11.12%
Quarterly Results Snapshot (Standalone) - Mar'26 - QoQ

QoQ Growth in quarter ended Mar 2026 is 4.87% vs 10.39% in Dec 2025
QoQ Growth in quarter ended Mar 2026 is 48.88% vs 111.59% in Dec 2025
Half Yearly Results Snapshot (Consolidated) - Sep'25
Not Applicable: The company has declared_date for only one period
Not Applicable: The company has declared_date for only one period
Nine Monthly Results Snapshot (Consolidated) - Dec'25
Not Applicable: The company has declared_date for only one period
Not Applicable: The company has declared_date for only one period
Annual Results Snapshot (Consolidated) - Mar'26
YoY Growth in year ended Mar 2026 is 19.32% vs 25.91% in Mar 2025
YoY Growth in year ended Mar 2026 is 31.03% vs 569.47% in Mar 2025
About Fractal Analytics Ltd

Company Coordinates


