
Compare Fusion Finance with Similar Stocks
Dashboard
Weak Long Term Fundamental Strength with an average Return on Equity (ROE) of 0.28%
- Poor long term growth as Net Sales has grown by an annual rate of -1.28% and Operating profit at -25.59%
With ROE of 0.6, it has a Very Expensive valuation with a 1.1 Price to Book Value
Reducing Promoter Confidence
Consistent Underperformance against the benchmark over the last 3 years
Total Returns (Price + Dividend) 
Fusion Finance for the last several years.
Risk Adjusted Returns v/s
Returns Beta

News

Fusion Finance Ltd is Rated Sell by MarketsMOJO
Fusion Finance Ltd is rated 'Sell' by MarketsMOJO, with this rating last updated on 07 May 2026. However, the analysis and financial metrics discussed here reflect the stock's current position as of 10 June 2026, providing investors with the most up-to-date view of the company’s fundamentals, valuation, financial trends, and technical outlook.
Read full news article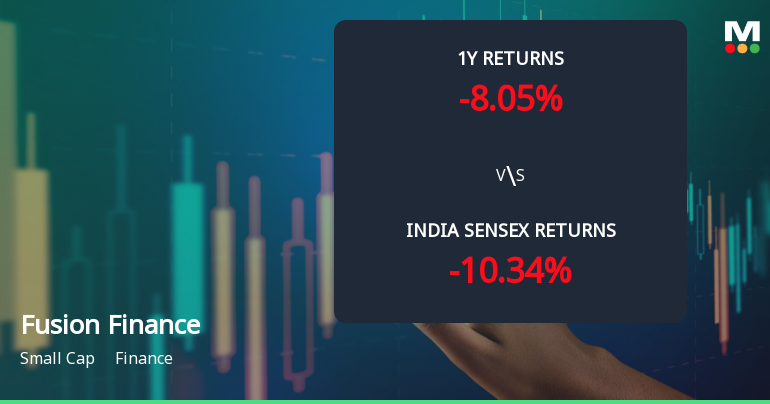
Fusion Finance Ltd Technical Momentum Shifts Amid Mixed Indicator Signals
Fusion Finance Ltd has exhibited a notable shift in its technical momentum, moving from a sideways trend to a mildly bullish stance, despite a complex mix of indicator signals. The stock’s recent price action, combined with evolving technical parameters, suggests cautious optimism for investors amid persistent sector challenges and a small-cap market cap profile.
Read full news article
Fusion Finance Ltd Technical Momentum Shifts Amid Mixed Market Signals
Fusion Finance Ltd, a small-cap player in the finance sector, has experienced a notable shift in its technical momentum, reflecting a complex interplay of bearish and bullish signals across key indicators. The stock’s recent price movement and technical parameters suggest a sideways trend, challenging investors to reassess its near-term outlook amid broader market volatility.
Read full news article Announcements
Announcement under Regulation 30 (LODR)-Analyst / Investor Meet - Intimation
05-Jun-2026 | Source : BSEAnnouncement under Regulation 30 of SEBI LODR Regulations 2015
The Company Is In Receipt Of An Order Passed By The Income Tax Appellate Tribunal (ITAT) New Delhi For Dismissal Of The Appeal Filed By The Income Tax Officer (ITO) Under The Income Tax Act 1961.
02-Jun-2026 | Source : BSEAs per detailed disclosure enclosed
Announcement under Regulation 30 (LODR)-Cessation
23-May-2026 | Source : BSEAnnouncement under Regulation 30 (LODR)- Completion of Tenure (Second & Final Term) of Independent Director is enclosed.
Corporate Actions

No Upcoming Board Meetings

No Dividend history available

No Splits history available

No Bonus history available

Fusion Finance Ltd has announced 55:91 rights issue, ex-date: 04 Apr 25
Quality key factors
Valuation key factors
Technicals key factors
 Technical Indicator Scale: Bearish, Mildly Bearish, Sideways, Mildly Bullish, Bullish Turned
 Shareholding Snapshot : Mar 2026
Shareholding Compare (%holding)
Promoters
2.8504
Held by 9 Schemes (9.3%)
Held by 37 FIIs (4.74%)
Honey Rose Investment Ltd (35.2%)
Hdfc Mutual Fund - Hdfc Banking And Financial Services Fund (3.85%)
18.32%
Quarterly Results Snapshot (Standalone) - Mar'26 - QoQ

QoQ Growth in quarter ended Mar 2026 is 0.51% vs -0.38% in Dec 2025
QoQ Growth in quarter ended Mar 2026 is 712.74% vs 163.46% in Dec 2025
Half Yearly Results Snapshot (Standalone) - Sep'25

Growth in half year ended Sep 2025 is -39.47% vs 28.04% in Sep 2024
Growth in half year ended Sep 2025 is 66.42% vs -238.40% in Sep 2024
Nine Monthly Results Snapshot (Standalone) - Dec'25
YoY Growth in nine months ended Dec 2025 is -33.40% vs 10.95% in Dec 2024
YoY Growth in nine months ended Dec 2025 is 90.53% vs -384.48% in Dec 2024
Annual Results Snapshot (Standalone) - Mar'26
YoY Growth in year ended Mar 2026 is -29.48% vs 0.13% in Mar 2025
YoY Growth in year ended Mar 2026 is 101.13% vs -342.34% in Mar 2025
About Fusion Finance Ltd

Company Coordinates


