
Compare Muthoot Microfin with Similar Stocks
Dashboard
With a growth in Net Profit of 13.9%, the company declared Outstanding results in Mar 26
- The company has declared positive results for the last 4 consecutive quarters
- OPERATING PROFIT TO INTEREST(Q) Highest at 1.43 times
- PAT(Q) At Rs 71.12 cr has Grown at 194.2% (vs previous 4Q average)
- NET SALES(Q) Highest at Rs 631.81 cr
High Institutional Holdings at 26.33%
Market Beating Performance
Total Returns (Price + Dividend) 
Muthoot Microfin for the last several years.
Risk Adjusted Returns v/s
Returns Beta

News
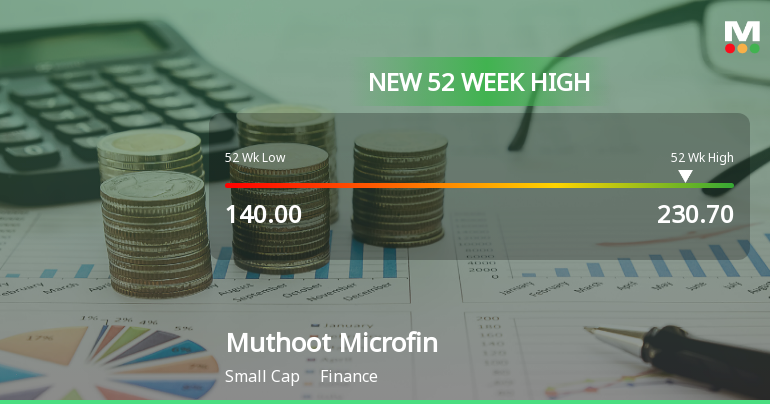
Broad-Based Technical Strength Lifts Muthoot Microfin Ltd to 52-Week High of Rs 225.9
With a 57.66% gain over the past year, Muthoot Microfin Ltd surged to a fresh 52-week high of Rs 225.9 on 3 Jul 2026, outpacing the Sensex which declined by 6.33% over the same period. This milestone caps a sustained rally fuelled by robust technical momentum and improving fundamentals.
Read full news article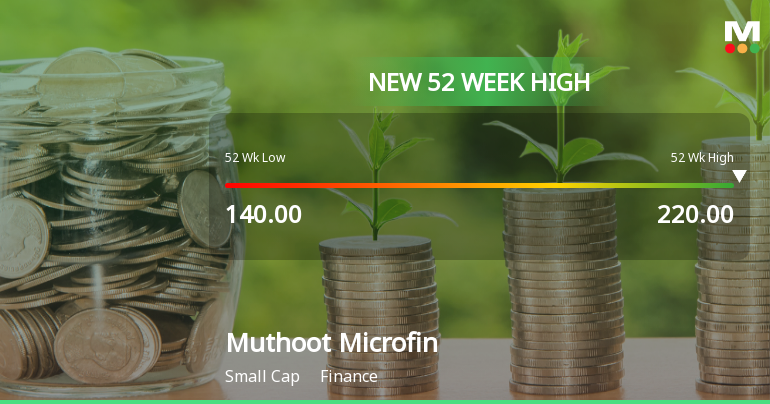
Broad-Based Technical Strength Lifts Muthoot Microfin Ltd to 52-Week High of Rs 220
With a decisive surge to Rs 220 on 1 Jul 2026, Muthoot Microfin Ltd has reached a fresh 52-week high, extending its impressive 53.79% rally over the past year. This milestone comes amid a backdrop of strong technical momentum and sustained outperformance versus the broader market indices.
Read full news article
Muthoot Microfin Ltd is Rated Buy by MarketsMOJO
Muthoot Microfin Ltd is rated Buy by MarketsMOJO, with this rating last updated on 16 June 2026. However, the analysis and financial metrics discussed here reflect the stock’s current position as of 28 June 2026, providing investors with the latest insights into its performance and outlook.
Read full news article Announcements
Corporate Actions

No Upcoming Board Meetings

No Dividend history available

No Splits history available

No Bonus history available

No Rights history available
Quality key factors
Valuation key factors
Technicals key factors
 Technical Indicator Scale: Bearish, Mildly Bearish, Sideways, Mildly Bullish, Bullish Turned
 Shareholding Snapshot : Mar 2026
Shareholding Compare (%holding)
Promoters
None
Held by 2 Schemes (0.04%)
Held by 10 FIIs (22.82%)
Muthoot Fincorp Ltd (50.21%)
Greater Pacific Capital Wiv Ltd (15.13%)
13.65%
Quarterly Results Snapshot (Standalone) - Mar'26 - QoQ

QoQ Growth in quarter ended Mar 2026 is 4.81% vs 4.59% in Dec 2025

QoQ Growth in quarter ended Mar 2026 is 13.90% vs 104.59% in Dec 2025
Half Yearly Results Snapshot (Standalone) - Sep'25
Growth in half year ended Sep 2025 is -14.40% vs 27.20% in Sep 2024
Growth in half year ended Sep 2025 is -79.01% vs -14.83% in Sep 2024
Nine Monthly Results Snapshot (Standalone) - Dec'25
YoY Growth in nine months ended Dec 2025 is -13.40% vs 23.94% in Dec 2024
YoY Growth in nine months ended Dec 2025 is -44.50% vs -45.84% in Dec 2024
Annual Results Snapshot (Standalone) - Mar'26
YoY Growth in year ended Mar 2026 is -7.50% vs 13.91% in Mar 2025
YoY Growth in year ended Mar 2026 is 176.52% vs -149.50% in Mar 2025
About Muthoot Microfin Ltd

Company Coordinates


