
Compare GAIL (India) with Similar Stocks
Dashboard
With a fall in Net Sales of -0.11%, the company declared Very Negative results in Mar 26
- The company has declared negative results for the last 3 consecutive quarters
- PAT(Q) At Rs 1,484.72 cr has Fallen at -30.9% (vs previous 4Q average)
- ROCE(HY) Lowest at 9.39%
- PBDIT(Q) Lowest at Rs 1,453.39 cr.
Total Returns (Price + Dividend) 
Latest dividend: 5 per share ex-dividend date: Feb-05-2026
Risk Adjusted Returns v/s
Returns Beta

News

GAIL (India) Ltd Technical Momentum Shifts Amid Mixed Indicator Signals
GAIL (India) Ltd has experienced a notable shift in its technical momentum, moving from a mildly bearish stance to a sideways trend, reflecting a complex interplay of bullish and bearish signals across key technical indicators. Despite a modest day gain of 0.69%, the stock’s technical landscape reveals a nuanced picture that investors should carefully consider amid evolving market conditions.
Read full news article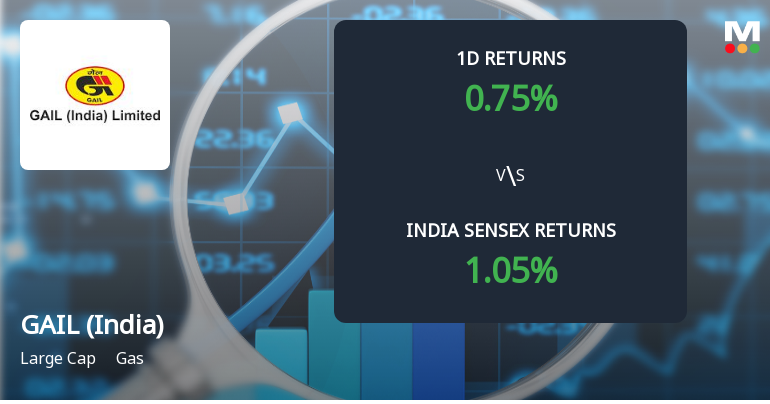
GAIL (India) Ltd Sees Sharp Open Interest Surge Amid Mixed Market Signals
GAIL (India) Ltd has witnessed a notable 11.8% increase in open interest in its derivatives segment, signalling heightened market activity and shifting investor positioning. Despite a modest price gain of 0.89% on 24 Jun 2026, the surge in open interest alongside volume patterns suggests evolving directional bets amid a complex backdrop of sectoral and broader market movements.
Read full news article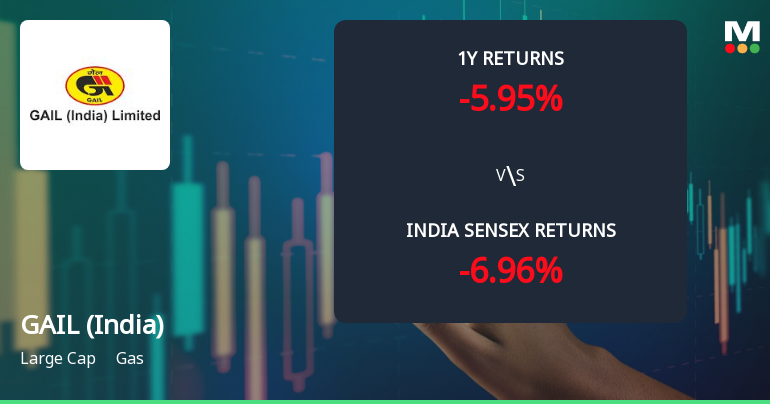
GAIL (India) Ltd Faces Mixed Technical Signals Amid Mildly Bearish Momentum
GAIL (India) Ltd, a prominent player in the gas sector, has recently experienced a shift in its technical momentum, moving from a sideways trend to a mildly bearish stance. Despite some bullish weekly indicators, monthly signals suggest caution, reflecting a complex technical landscape for investors to navigate.
Read full news article Announcements
Change In Directorship - Appointment Of Director (Finance)
22-Jun-2026 | Source : BSEThis is to inform that a letter bearing no. CA-31022/2/2024-CA-PNG (49911) dated 22.06.2026 has been received from the Ministry of Petroleum and Natural Gas Government of India (MoP&NG) nominating Shri Satish Kumar Sinha (DIN-10528036)) Executive Director GAIL as a Director (Finance) with effect from the date of his assumption of charge of the post on or after 01.07.2026 till the date of his superannuation i.e. 31.05.2029 or until further orders whichever is the earlier. The Company is taking necessary action to complete the appointment formalities and requisite disclosures in this regard will be submitted in due course.
Honble NCLT Order Dated 03.06.2026 In The Matter Of Konkan LNG Limited
10-Jun-2026 | Source : BSEThis is to inform that Konkan LNG Limited (KLL) a subsidiary of GAIL (India) Limited (GAIL) filed a Scheme for Reduction of Equity Share Capital before the Honble National Company Law Tribunal (NCLT) during June 2025 for the reduction of KLL existing equity share capital by cancellation and extinguishment in aggregate of 148110440 equity shares forming part of the issued subscribed and paid-up equity share capital of KLL comprising 74055220 equity shares of Rs.10 each held by GAIL and MSEB Holding Company Limited (MSEB). Honble NCLT vide its order dated 3rd June 2026 sanctioned the said Scheme and certified true copy of the same was received on 10th June 2026. Consequent upon the implementation of the Scheme the shareholding of MSEB in KLL shall stand reduced to Nil and GAIL shareholding will stand increased to 100% of the equity share capital of KLL.
Announcement under Regulation 30 (LODR)-Change in Directorate
04-Jun-2026 | Source : BSEThis is with reference to Ministry of Petroleum & Natural Gas (MoP&NG) Letter No.CA-31022/1/2021-CA-PNG (37493) dated 04.06.2026 regarding nomination of Shri Kushagra Mittal Director MoP&NG (DIN: 09026246) on the Board of the Company w.e.f. 04.06.2026 and upto 10.08.2026 and information pertaining to him are as per attached disclosure
Corporate Actions

No Upcoming Board Meetings

GAIL (India) Ltd has declared 50% dividend, ex-date: 05 Feb 26

No Splits history available

GAIL (India) Ltd has announced 1:2 bonus issue, ex-date: 06 Sep 22

No Rights history available
Quality key factors
Valuation key factors
Technicals key factors
 Technical Indicator Scale: Bearish, Mildly Bearish, Sideways, Mildly Bullish, Bullish Turned
 Shareholding Snapshot : Dec 2025
Shareholding Compare (%holding)
Promoters
None
Held by 35 Schemes (10.22%)
Held by 713 FIIs (14.07%)
President Of India (51.88%)
Lici Annuity Non-par (7.25%)
5.63%
Quarterly Results Snapshot (Consolidated) - Mar'26 - QoQ

QoQ Growth in quarter ended Mar 2026 is 1.15% vs -1.02% in Dec 2025

QoQ Growth in quarter ended Mar 2026 is -15.46% vs -10.96% in Dec 2025
Half Yearly Results Snapshot (Consolidated) - Sep'25
Growth in half year ended Sep 2025 is 3.24% vs 4.34% in Sep 2024
Growth in half year ended Sep 2025 is -26.12% vs 38.73% in Sep 2024
Nine Monthly Results Snapshot (Consolidated) - Dec'25
YoY Growth in nine months ended Dec 2025 is 0.53% vs 4.97% in Dec 2024
YoY Growth in nine months ended Dec 2025 is -38.77% vs 34.02% in Dec 2024
Annual Results Snapshot (Consolidated) - Mar'26
YoY Growth in year ended Mar 2026 is -0.21% vs 6.51% in Mar 2025
YoY Growth in year ended Mar 2026 is -39.10% vs 25.77% in Mar 2025
About GAIL (India) Ltd

Company Coordinates


