
Compare Ganesh Consumer with Similar Stocks
Dashboard
Strong ability to service debt as the company has a low Debt to EBITDA ratio of 2.64 times
Poor long term growth as Net Sales has grown by an annual rate of 0% over the last 5 years
Positive results in Mar 26
With ROE of 11.5, it has a Very Attractive valuation with a 2.2 Price to Book Value
Falling Participation by Institutional Investors
Stock DNA
Other Agricultural Products
INR 807 Cr (Micro Cap)
19.00
46
1.24%
-0.01
11.51%
2.21
Total Returns (Price + Dividend) 
Latest dividend: 2.5 per share ex-dividend date: Nov-14-2025
Risk Adjusted Returns v/s
Returns Beta

News

Ganesh Consumer Products Ltd is Rated Hold
Ganesh Consumer Products Ltd is rated 'Hold' by MarketsMOJO, with this rating last updated on 27 April 2026. While the rating change occurred on that date, the analysis and financial metrics presented here reflect the stock's current position as of 11 June 2026, providing investors with an up-to-date view of the company’s fundamentals, valuation, financial trends, and technical outlook.
Read full news article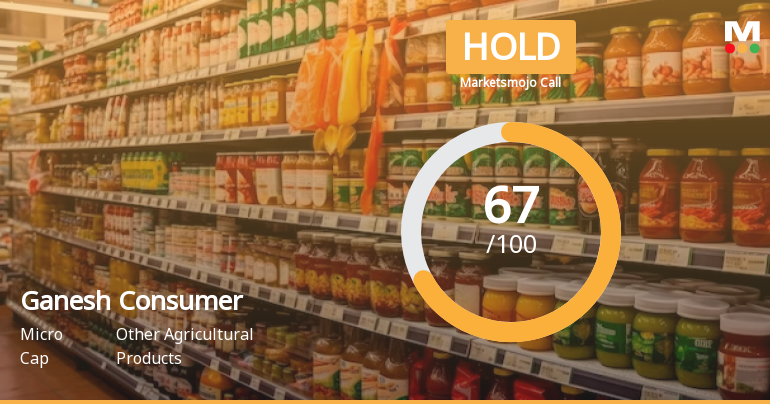
Ganesh Consumer Products Ltd is Rated Hold by MarketsMOJO
Ganesh Consumer Products Ltd is rated 'Hold' by MarketsMOJO, with this rating last updated on 27 Apr 2026. However, the analysis and financial metrics discussed here reflect the stock's current position as of 31 May 2026, providing investors with an up-to-date view of the company’s fundamentals, valuation, financial trends, and technical outlook.
Read full news articleAre Ganesh Consumer Products Ltd latest results good or bad?
Ganesh Consumer Products Ltd's latest financial results for Q4 FY26 present a mixed picture. The company reported a net profit of ₹9.54 crores, which reflects a significant year-on-year increase of 108.75%, although it represents a decline of 21.80% compared to the previous quarter. This substantial year-on-year growth is notable against a weaker base from the prior year, yet the sequential drop raises concerns about ongoing operational challenges. Net sales for the quarter were ₹218.04 crores, showing a slight decline of 0.94% year-on-year, but a recovery with a 2.97% increase compared to the previous quarter. This suggests some stabilization in demand after a notable drop in Q3 FY26. However, the overall revenue trajectory indicates volatility, with quarterly sales fluctuating significantly throughout the fiscal year. Operating margins have come under pressure, declining to 8.02% from 10.80% in the prev...
Read full news article Announcements
Disclosure Of Acquisition Of Securities Under Regulation 7(2) Of The Securities And Exchange Board Of India (Prohibition Of Insider Trading) Regulations 2015
04-Jun-2026 | Source : BSEDisclosure of Acquisition of Securities under Regulation 7(2) of Securities and Exchange Board of India (Prohibition of Insider Trading) Regulations2015
Announcement under Regulation 30 (LODR)-Analyst / Investor Meet - Outcome
25-May-2026 | Source : BSEAudio of Investors Conference Call for QTR ended March 31st 2026
Compliances-Reg.24(A)-Annual Secretarial Compliance
25-May-2026 | Source : BSEAnnual Secretarial Compliance Report for the Financial Year ended March 31st 2026
Corporate Actions

No Upcoming Board Meetings

Ganesh Consumer Products Ltd has declared 25% dividend, ex-date: 14 Nov 25

No Splits history available

No Bonus history available

No Rights history available
Quality key factors
Valuation key factors
Technicals key factors
 Technical Indicator Scale: Bearish, Mildly Bearish, Sideways, Mildly Bullish, Bullish Turned
 Shareholding Snapshot : Mar 2026
Shareholding Compare (%holding)
Promoters
None
Held by 0 Schemes
Held by 10 FIIs (2.78%)
Srivaru Agro Private Limited (58.87%)
Subhkam Ventures I Pvt Ltd (3.42%)
13.9%
Quarterly Results Snapshot (Standalone) - Mar'26 - QoQ

QoQ Growth in quarter ended Mar 2026 is 2.97% vs -11.28% in Dec 2025

QoQ Growth in quarter ended Mar 2026 is -21.80% vs 9.71% in Dec 2025
Half Yearly Results Snapshot (Standalone) - Sep'25
Not Applicable: The company has declared_date for only one period
Not Applicable: The company has declared_date for only one period
Nine Monthly Results Snapshot (Standalone) - Dec'25
Not Applicable: The company has declared_date for only one period
Not Applicable: The company has declared_date for only one period
Annual Results Snapshot (Standalone) - Mar'26
YoY Growth in year ended Mar 2026 is 2.46% vs 12.04% in Mar 2025
YoY Growth in year ended Mar 2026 is 19.64% vs 31.27% in Mar 2025
About Ganesh Consumer Products Ltd

Company Coordinates


