
Compare Gateway Distri with Similar Stocks
Stock DNA
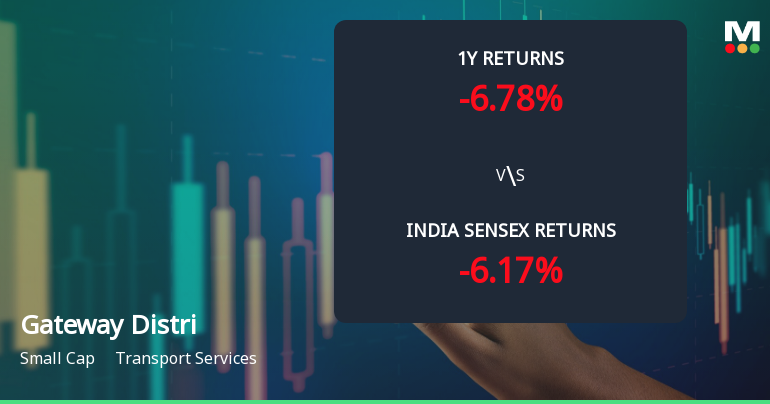
Transport Services
INR 2,936 Cr (Small Cap)
11.00
39
5.35%
0.23
11.26%
1.26
Total Returns (Price + Dividend) 
Latest dividend: 1.2 per share ex-dividend date: Feb-12-2026
Risk Adjusted Returns v/s
Returns Beta

News
Gateway Distriparks Ltd Technical Momentum Shifts Amid Mixed Market Signals
Gateway Distriparks Ltd, a small-cap player in the Transport Services sector, has recently experienced a subtle shift in its technical momentum, moving from a sideways trend to a mildly bearish stance. This change is underscored by a complex interplay of technical indicators including MACD, RSI, moving averages, and Bollinger Bands, signalling a nuanced outlook for investors as the stock navigates near ₹61.72.
Read full news article
Gateway Distriparks Ltd is Rated Sell
Gateway Distriparks Ltd is rated Sell by MarketsMOJO, with this rating last updated on 29 June 2026. However, the analysis and financial metrics discussed here reflect the stock's current position as of 05 July 2026, providing investors with the latest insights into its performance and outlook.
Read full news article
Gateway Distriparks Ltd Technical Momentum Shifts Amid Mixed Market Signals
Gateway Distriparks Ltd has experienced a notable shift in its technical momentum, moving from a mildly bearish stance to a more sideways trend. Despite a recent 2.58% gain in the stock price to ₹59.27, the overall technical indicators present a mixed picture, reflecting both bullish and bearish signals across different timeframes. This nuanced technical landscape warrants a detailed analysis for investors seeking clarity on the stock’s near-term prospects.
Read full news article Announcements
Corporate Actions

No Upcoming Board Meetings

Gateway Distriparks Ltd has declared 7% dividend, ex-date: 12 Feb 26

No Splits history available

No Bonus history available

No Rights history available
Quality key factors
Valuation key factors
Technicals key factors
 Technical Indicator Scale: Bearish, Mildly Bearish, Sideways, Mildly Bullish, Bullish Turned
 Shareholding Snapshot : Mar 2026
Shareholding Compare (%holding)
Promoters
None
Held by 8 Schemes (32.28%)
Held by 86 FIIs (6.65%)
Prism International Private Limited (24.09%)
Hdfc Small Cap Fund (9.46%)
21.64%
Quarterly Results Snapshot (Consolidated) - Mar'26 - QoQ

QoQ Growth in quarter ended Mar 2026 is -4.78% vs -1.22% in Dec 2025
QoQ Growth in quarter ended Mar 2026 is -10.69% vs 1.30% in Dec 2025
Half Yearly Results Snapshot (Consolidated) - Sep'25

Growth in half year ended Sep 2025 is 50.42% vs -3.27% in Sep 2024
Growth in half year ended Sep 2025 is 17.16% vs -20.13% in Sep 2024
Nine Monthly Results Snapshot (Consolidated) - Dec'25
YoY Growth in nine months ended Dec 2025 is 46.48% vs -1.34% in Dec 2024
YoY Growth in nine months ended Dec 2025 is -65.41% vs 183.07% in Dec 2024
Annual Results Snapshot (Consolidated) - Mar'26
YoY Growth in year ended Mar 2026 is 31.61% vs 9.40% in Mar 2025
YoY Growth in year ended Mar 2026 is -31.06% vs 44.74% in Mar 2025
About Gateway Distriparks Ltd

Company Coordinates


