
Compare Gayatri Projects with Similar Stocks
Dashboard
Weak Long Term Fundamental Strength with an average Return on Capital Employed (ROCE) of 0%
- Poor long term growth as Net Sales has grown by an annual rate of -26.32% and Operating profit at -160.79% over the last 5 years
- Company's ability to service its debt is weak with a poor EBIT to Interest (avg) ratio of -5.96
Risky - Negative EBITDA
Stock DNA
Construction
INR 963 Cr (Micro Cap)
13.00
44
0.00%
0.48
12.78%
1.61
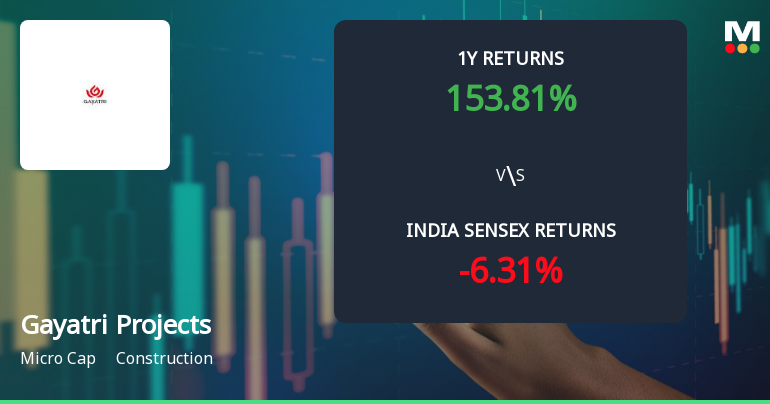
Total Returns (Price + Dividend) 
Latest dividend: 0.4 per share ex-dividend date: Sep-21-2016
Risk Adjusted Returns v/s
Returns Beta

News
Gayatri Projects Ltd Technical Momentum Shifts Amid Mixed Market Signals
Gayatri Projects Ltd, a micro-cap player in the construction sector, has experienced a notable shift in its technical momentum, moving from a bullish to a mildly bullish trend. Despite a recent downgrade in its Mojo Grade from Hold to Sell, the stock’s technical indicators present a complex picture, reflecting both positive and negative signals that investors should carefully analyse.
Read full news article
Gayatri Projects Ltd is Rated Sell
Gayatri Projects Ltd is rated 'Sell' by MarketsMOJO, with this rating last updated on 14 May 2026. However, the analysis and financial metrics discussed here reflect the stock's current position as of 06 July 2026, providing investors with the latest insights into the company’s performance and outlook.
Read full news article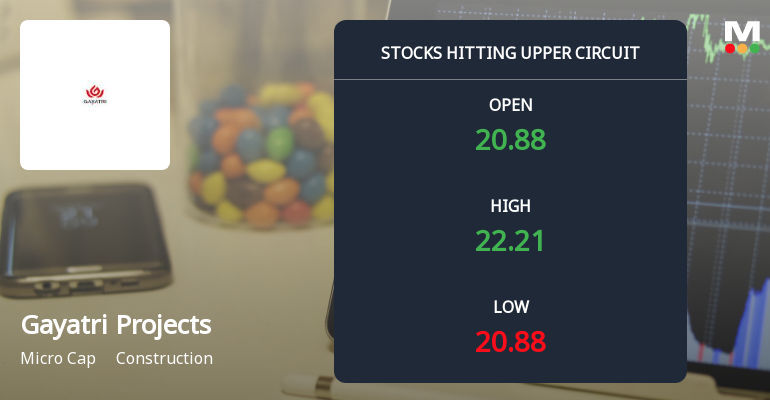
Gayatri Projects Ltd Locks at Upper Circuit With 4.96% Gain — Buyers Queue, Sellers Absent
At Rs 22.42, the buying was done — not because demand dried up, but because the exchange wouldn't let the stock go any higher. Gayatri Projects Ltd locked at its upper circuit of 4.96% on 1 Jul 2026, with buyers queuing and no sellers willing to part with shares.
Read full news article Announcements
Gayatri Projects Limited - Updates
09-Dec-2019 | Source : NSEGayatri Projects Limited has informed the Exchange regarding 'Submission of information pursuant to Regulation 30 of SEBI (Listing Obligations
Gayatri Projects Limited - Resignation
05-Dec-2019 | Source : NSEGayatri Projects Limited has informed the Exchange regarding Resignation of Mr K JAIRAJ as Non- Executive Independent Director of the company w.e.f. December 04, 2019.
Gayatri Projects Limited - Updates
18-Nov-2019 | Source : NSEGayatri Projects Limited has informed the Exchange regarding 'With reference to the above subject, we wish to inform you that M/s. Catalyst Trustee sold 55,206 equity shares of promoters of Gayatri Projects Limited on 13th November, 2019. The promoter of Gayatri Projects Limited had pledged these shares as additional collateral for the loans taken by its wholly owned subsidiary M/s. Gayatri Energy Ventures Limited - the investment arm of its power assets. M/s. Gayatri Energy Ventures Limited (wholly owned subsidiary) is in discussion with the trustee for the repayment of the outstanding liability and is in touch with M/s. Catalyst Trustee and has appraised them of strategic actions being taken to shortly repay the liability in full. '.
Corporate Actions

No Upcoming Board Meetings

Gayatri Projects Ltd has declared 20% dividend, ex-date: 21 Sep 16

Gayatri Projects Ltd has announced 2:10 stock split, ex-date: 10 Feb 17

No Bonus history available

Gayatri Projects Ltd has announced 1:1 rights issue, ex-date: 22 Feb 12
Quality key factors
Valuation key factors
Technicals key factors
 Technical Indicator Scale: Bearish, Mildly Bearish, Sideways, Mildly Bullish, Bullish Turned
 Shareholding Snapshot : Apr 2026
Shareholding Compare (%holding)
Non Institution
4.9785
Held by 0 Schemes
Held by 9 FIIs (12.62%)
Indira Subbaramireddy Tikkavarapu (2.32%)
Antara India Evergreen Fund (11.82%)
25.76%
Quarterly Results Snapshot (Consolidated) - Mar'26 - YoY

YoY Growth in quarter ended Mar 2026 is 39.52% vs -16.61% in Mar 2025

YoY Growth in quarter ended Mar 2026 is -169.95% vs 80.80% in Mar 2025
Half Yearly Results Snapshot (Consolidated) - Sep'25
Growth in half year ended Sep 2025 is -32.55% vs -42.35% in Sep 2024
Growth in half year ended Sep 2025 is 87.94% vs 3.21% in Sep 2024
Nine Monthly Results Snapshot (Consolidated) - Dec'25
YoY Growth in nine months ended Dec 2025 is 109.58% vs -39.28% in Dec 2024
YoY Growth in nine months ended Dec 2025 is 6,287.13% vs 24.87% in Dec 2024
Annual Results Snapshot (Consolidated) - Mar'26
YoY Growth in year ended Mar 2026 is 88.23% vs -33.79% in Mar 2025
YoY Growth in year ended Mar 2026 is 1,548.33% vs 198.82% in Mar 2025
About Gayatri Projects Ltd

Company Coordinates


