
Compare Genesys Intl. with Similar Stocks
Stock DNA
Computers - Software & Consulting
INR 1,346 Cr (Small Cap)
40.00
20
0.00%
0.10
4.99%
1.95
Total Returns (Price + Dividend) 
Latest dividend: 0.1 per share ex-dividend date: Sep-18-2019
Risk Adjusted Returns v/s
Returns Beta

News
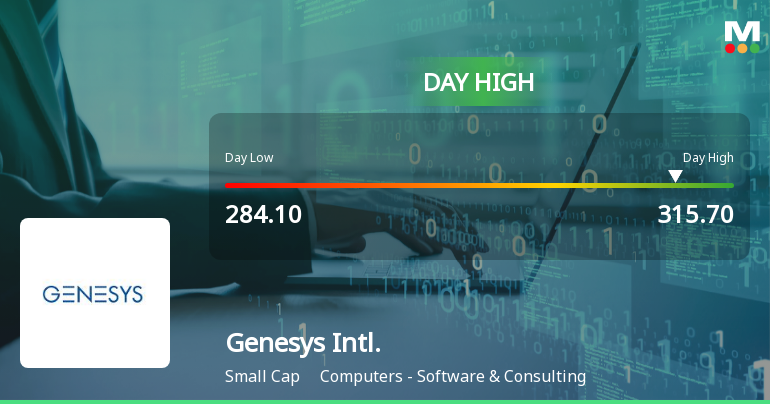
Genesys International Corporation Ltd Surges 10.62% to Day's High of Rs 307.1 — Outperforms Sector by 8.23 Percentage Points
The Sensex climbed 0.66% on 10 Jun 2026, yet Genesys International Corporation Ltd surged 10.62%, outperforming its sector by a notable 8.23 percentage points. This sharp single-session gain rewrites the short-term narrative for the small-cap software and consulting firm, raising questions about the sustainability and nature of this rally.
Read full news article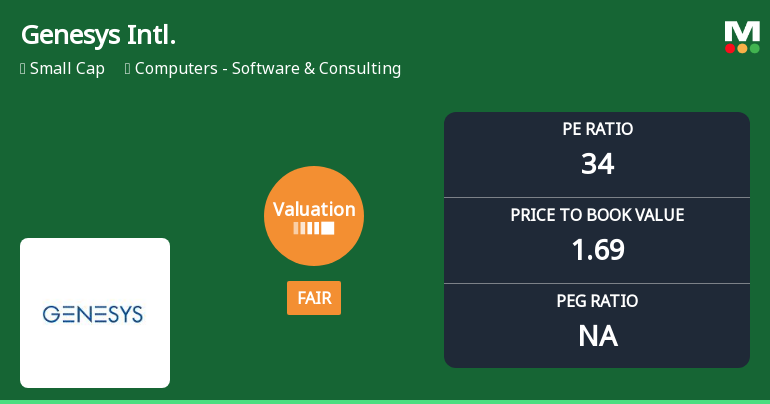
Genesys International Corporation Ltd Valuation Shifts Amid Mixed Market Returns
Genesys International Corporation Ltd has seen its valuation grade improve from attractive to fair, reflecting a notable shift in market perception despite ongoing challenges in its financial performance and stock returns. This article analyses the recent changes in key valuation parameters, compares them with industry peers, and assesses the implications for investors in the Computers - Software & Consulting sector.
Read full news article
Genesys International Corporation Ltd is Rated Sell
Genesys International Corporation Ltd is rated 'Sell' by MarketsMOJO, with this rating last updated on 01 June 2026. However, the analysis and financial metrics discussed here reflect the stock's current position as of 09 June 2026, providing investors with the latest insights into the company’s performance and outlook.
Read full news article Announcements
Announcement under Regulation 30 (LODR)-Amendments to Memorandum & Articles of Association
01-Jun-2026 | Source : BSEPlease find attached herewith intimation relating to Amendments in MOA of the Company
Shareholder Meeting / Postal Ballot-Scrutinizers Report
01-Jun-2026 | Source : BSEResults of Postal Ballot of Genesys International Corporation Limited under Regulation 44 of SEBI (LODR) Regulations 2015
Shareholder Meeting / Postal Ballot-Outcome of Postal_Ballot
01-Jun-2026 | Source : BSEResults of Postal Ballot of Genesys International Corporation Limited under Regulation 44 of SEBI (LODR) Regulations 2015
Corporate Actions

No Upcoming Board Meetings

Genesys International Corporation Ltd has declared 2% dividend, ex-date: 18 Sep 19

Genesys International Corporation Ltd has announced 5:10 stock split, ex-date: 23 Jun 10

No Bonus history available

No Rights history available
Quality key factors
Valuation key factors
Technicals key factors
 Technical Indicator Scale: Bearish, Mildly Bearish, Sideways, Mildly Bullish, Bullish Turned
 Shareholding Snapshot : Mar 2026
Shareholding Compare (%holding)
Non Institution
9.0085
Held by 0 Schemes
Held by 24 FIIs (2.34%)
Kilam Holdings Ltd (15.29%)
Sunita O Hemrajani (5.17%)
46.74%
Quarterly Results Snapshot (Consolidated) - Mar'26 - QoQ

QoQ Growth in quarter ended Mar 2026 is 37.53% vs -1.52% in Dec 2025
QoQ Growth in quarter ended Mar 2026 is 1,033.94% vs -90.92% in Dec 2025
Half Yearly Results Snapshot (Consolidated) - Sep'25

Growth in half year ended Sep 2025 is 15.68% vs 88.63% in Sep 2024
Growth in half year ended Sep 2025 is 15.11% vs 292.47% in Sep 2024
Nine Monthly Results Snapshot (Consolidated) - Dec'25
YoY Growth in nine months ended Dec 2025 is 3.10% vs 70.66% in Dec 2024
YoY Growth in nine months ended Dec 2025 is -45.77% vs 415.49% in Dec 2024
Annual Results Snapshot (Consolidated) - Mar'26
YoY Growth in year ended Mar 2026 is 5.39% vs 56.90% in Mar 2025
YoY Growth in year ended Mar 2026 is -42.05% vs 154.73% in Mar 2025
About Genesys International Corporation Ltd

Company Coordinates


