
Compare Gennex Lab. with Similar Stocks
Stock DNA
Pharmaceuticals & Biotechnology
INR 249 Cr (Micro Cap)
13.00
33
0.00%
0.12
8.61%
1.13
Total Returns (Price + Dividend) 
Gennex Lab. for the last several years.
Risk Adjusted Returns v/s
Returns Beta

News

Gennex Laboratories Ltd is Rated Hold
Gennex Laboratories Ltd is rated 'Hold' by MarketsMOJO, with this rating last updated on 01 June 2026. However, the analysis and financial metrics discussed here reflect the stock's current position as of 11 June 2026, providing investors with an up-to-date view of the company’s fundamentals, returns, and market standing.
Read full news articleAre Gennex Laboratories Ltd latest results good or bad?
Gennex Laboratories Ltd's latest financial results for the quarter ended March 2026 present a complex picture. The company achieved net sales of ₹60.96 crores, reflecting a substantial year-on-year growth of 51.15%, which marks the highest quarterly revenue in its recent history. This growth indicates robust demand for Gennex's products, particularly in the active pharmaceutical ingredients (API) and intermediates segment. However, this impressive top-line growth was not mirrored in profitability metrics. The operating margin, excluding other income, fell sharply to 9.66% from 23.61% in the same quarter last year, indicating significant margin compression. This decline raises concerns about the company's cost management and pricing strategies, suggesting that the growth may have come at the expense of profitability. The net profit for the quarter was reported at ₹3.74 crores, which, while showing a year-on...
Read full news article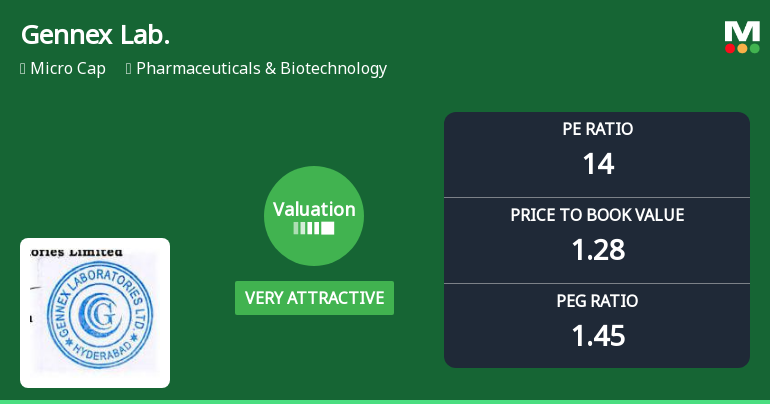
Gennex Laboratories Ltd Valuation Shifts Signal Renewed Price Attractiveness
Gennex Laboratories Ltd has witnessed a significant shift in its valuation parameters, moving from an attractive to a very attractive rating, driven by a notable decline in its price-to-earnings (P/E) and price-to-book value (P/BV) ratios. This change comes against a backdrop of mixed sector performance and a challenging market environment, prompting investors to reassess the stock’s price attractiveness relative to its peers and historical benchmarks.
Read full news article Announcements
Announcement under Regulation 30 (LODR)-Newspaper Publication
01-Jun-2026 | Source : BSEPursuant to Regulation 47 of SEBI (LODR) Regulations 2015 please find enclosed herewith Newspaper publication on Audited (Standalone and Consolidated) Financial Results for the Quarter and year ended March 31 2026 announced by the Board of Directors in its meeting held on May 30 2026. Financial Results had been published in both Business Standard (English) and Saksham (Telugu-Local) on June 01 2026. We request you to take the above information on record and acknowledge receipt of the same.
Financial Result For The Quarter And Year Ended March 31 2026
30-May-2026 | Source : BSEIn just concluded Meeting of Board of Directors the Board approved and considered the following items: 1. Audited Standalone & Consolidated Financial Results for the Quarter and Year ended March 31 2026. 2. Auditors Report on audited Standalone and Consolidated Financial Statements for the Quarter and Year ended March 31 2026 issued on dated May 30 2026 along with the Statement on Impact of Audit Qualification (Standalone and Consolidated) are attached herewith. We hereby submit that the Board Meeting had commenced at 4:00 pm and concluded at 7:30 pm. This intimation is also uploaded on the company website www.gennexlab.com
Board Meeting Outcome for Meeting Held On Today I.E. 30Th May 2026
30-May-2026 | Source : BSEIn just concluded Meeting of Board of Directors the Board Approved and considered the following items: 1. Audited Standalone & Consolidated Financial results for the Quarter & Year Ended March 31 2026; 2. Auditors Report on audited Standalone & Consolidated Financial Statements for the Quarter and Year ended March 31 2026 issued on dated May 30 2026 along with the Statement on Impact of Audit Qualification (Standalone & Consolidated) are attached herewith - Annexure I; We hereby submit that the Board Meeting had commenced at 4:00 PM and concluded at 7.30 PM. This intimation is also uploaded on the Company website: www.gennexlab.com. We request you to take the above information on record and acknowledge the receipt of the same.
Corporate Actions

No Upcoming Board Meetings

No Dividend history available

Gennex Laboratories Ltd has announced 1:10 stock split, ex-date: 14 Dec 09

No Bonus history available

Gennex Laboratories Ltd has announced 1:2 rights issue, ex-date: 21 Jul 22
Quality key factors
Valuation key factors
Technicals key factors
 Technical Indicator Scale: Bearish, Mildly Bearish, Sideways, Mildly Bullish, Bullish Turned
 Shareholding Snapshot : Mar 2026
Shareholding Compare (%holding)
Non Institution
17.4199
Held by 0 Schemes
Held by 0 FIIs
Premier Fiscal Services Private Limited (21.83%)
Jms Mines & Minerals Private Limited (3.25%)
55.79%
Quarterly Results Snapshot (Consolidated) - Mar'26 - YoY

YoY Growth in quarter ended Mar 2026 is 51.15% vs 13.54% in Mar 2025
YoY Growth in quarter ended Mar 2026 is 61.21% vs -48.44% in Mar 2025
Half Yearly Results Snapshot (Consolidated) - Sep'25

Growth in half year ended Sep 2025 is 11.30% vs 85.46% in Sep 2024
Growth in half year ended Sep 2025 is -4.09% vs 69.43% in Sep 2024
Nine Monthly Results Snapshot (Consolidated) - Dec'25
YoY Growth in nine months ended Dec 2025 is 9.79% vs 86.07% in Dec 2024
YoY Growth in nine months ended Dec 2025 is 1.30% vs 72.39% in Dec 2024
Annual Results Snapshot (Consolidated) - Mar'26
YoY Growth in year ended Mar 2026 is 16.46% vs 61.90% in Mar 2025
YoY Growth in year ended Mar 2026 is 14.52% vs 30.84% in Mar 2025
About Gennex Laboratories Ltd

Company Coordinates


