
Compare Geojit Fin. Ser. with Similar Stocks
Stock DNA
Capital Markets
INR 2,015 Cr (Small Cap)
23.00
20
2.07%
0.10
7.28%
1.68
Total Returns (Price + Dividend) 
Latest dividend: 1.5 per share ex-dividend date: Jul-11-2025
Risk Adjusted Returns v/s
Returns Beta

News

Geojit Financial Services Ltd is Rated Sell
Geojit Financial Services Ltd is rated 'Sell' by MarketsMOJO, with this rating last updated on 15 April 2026. However, the analysis and financial metrics presented here reflect the stock's current position as of 10 June 2026, providing investors with the latest insights into the company’s performance and outlook.
Read full news article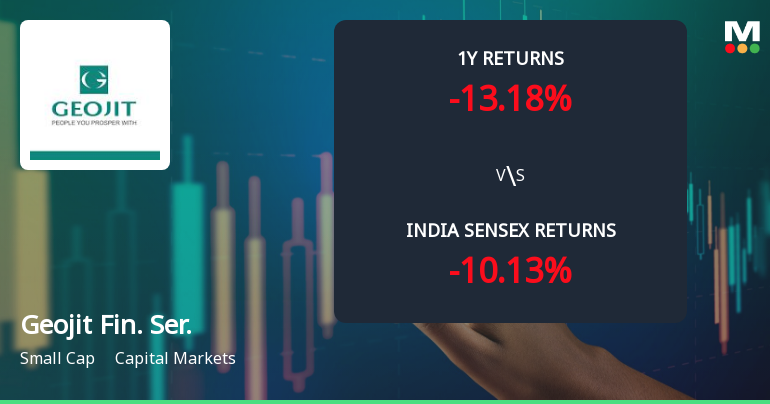
Geojit Financial Services Ltd Sees Technical Momentum Shift Amid Mixed Market Signals
Geojit Financial Services Ltd has experienced a notable shift in its technical momentum, transitioning from a mildly bearish trend to a sideways movement. Despite a recent day gain of 2.60%, the stock’s technical indicators present a complex picture, with bullish signals on weekly charts contrasting with bearish cues on monthly timeframes. Investors should weigh these mixed signals carefully as the stock navigates a challenging market environment.
Read full news article
Geojit Financial Services Ltd is Rated Sell
Geojit Financial Services Ltd is rated 'Sell' by MarketsMOJO, with this rating last updated on 15 Apr 2026. However, the analysis and financial metrics discussed here reflect the stock's current position as of 30 May 2026, providing investors with an up-to-date perspective on the company’s performance and outlook.
Read full news article Announcements
Announcement under Regulation 30 (LODR)-Analyst / Investor Meet - Outcome
07-May-2026 | Source : BSEPlease find enclosed the transcript for earnings call held on 30.04.2026
Announcement under Regulation 30 (LODR)-Change in Management
04-May-2026 | Source : BSEPlease find enclosed the intimation regarding cessation of senior management personnel
Announcement under Regulation 30 (LODR)-Newspaper Publication
30-Apr-2026 | Source : BSEPlease find enclosed herewith the newspaper publication dated 30.04.2026.
Corporate Actions

No Upcoming Board Meetings

Geojit Financial Services Ltd has declared 150% dividend, ex-date: 10 Jul 26

Geojit Financial Services Ltd has announced 1:10 stock split, ex-date: 26 Sep 06

No Bonus history available

Geojit Financial Services Ltd has announced 1:6 rights issue, ex-date: 07 Oct 24
Quality key factors
Valuation key factors
Technicals key factors
 Technical Indicator Scale: Bearish, Mildly Bearish, Sideways, Mildly Bullish, Bullish Turned
 Shareholding Snapshot : Mar 2026
Shareholding Compare (%holding)
Non Institution
9.3112
Held by 1 Schemes (0.0%)
Held by 44 FIIs (1.87%)
C J George (19.53%)
Rekha Jhunjhunwala (7.2%)
36.36%
Quarterly Results Snapshot (Consolidated) - Mar'26 - QoQ

QoQ Growth in quarter ended Mar 2026 is 17.43% vs -5.71% in Dec 2025
QoQ Growth in quarter ended Mar 2026 is 38.49% vs -43.09% in Dec 2025
Half Yearly Results Snapshot (Consolidated) - Sep'25

Growth in half year ended Sep 2025 is -19.17% vs 57.43% in Sep 2024
Growth in half year ended Sep 2025 is -50.21% vs 75.22% in Sep 2024
Nine Monthly Results Snapshot (Consolidated) - Dec'25
YoY Growth in nine months ended Dec 2025 is -15.43% vs 40.69% in Dec 2024
YoY Growth in nine months ended Dec 2025 is -53.97% vs 44.69% in Dec 2024
Annual Results Snapshot (Consolidated) - Mar'26
YoY Growth in year ended Mar 2026 is -10.27% vs 21.78% in Mar 2025
YoY Growth in year ended Mar 2026 is -52.00% vs 15.66% in Mar 2025
About Geojit Financial Services Ltd

Company Coordinates


