
Compare GIC Housing Fin with Similar Stocks
Dashboard
Weak Long Term Fundamental Strength with an average Return on Equity (ROE) of 9.19%
- Poor long term growth as Net Sales has grown by an annual rate of -1.50% and Operating profit at -2.37%
Flat results in Mar 26
Falling Participation by Institutional Investors
Consistent Underperformance against the benchmark over the last 3 years
Stock DNA
Housing Finance Company
INR 816 Cr (Micro Cap)
5.00
13
5.99%
4.33
7.35%
0.38
Total Returns (Price + Dividend) 
Latest dividend: 4.5112958895513025 per share ex-dividend date: Jun-25-2026
Risk Adjusted Returns v/s
Returns Beta

News

GIC Housing Finance Ltd is Rated Sell
GIC Housing Finance Ltd is rated 'Sell' by MarketsMOJO, with this rating last updated on 13 June 2026. However, the analysis and financial metrics presented here reflect the stock's current position as of 18 July 2026, providing investors with the latest insights into the company’s performance and outlook.
Read full news article
GIC Housing Finance Ltd is Rated Sell
GIC Housing Finance Ltd is rated 'Sell' by MarketsMOJO, with this rating last updated on 13 June 2026. However, the analysis and financial metrics discussed here reflect the stock's current position as of 07 July 2026, providing investors with an up-to-date perspective on the company’s fundamentals, valuation, financial trends, and technical outlook.
Read full news article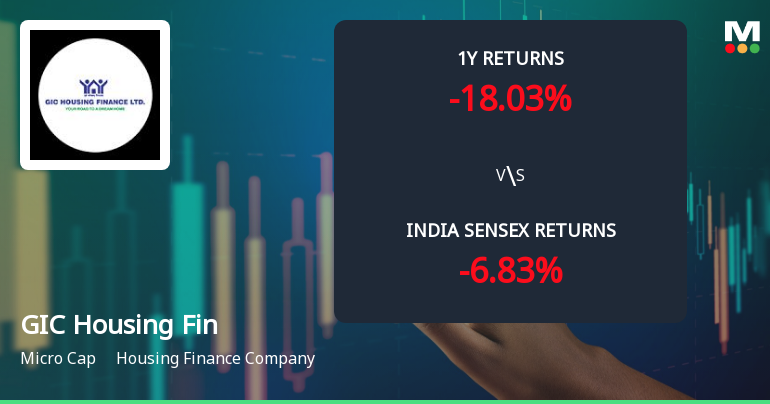
GIC Housing Finance Ltd Technical Momentum Shifts Amid Mixed Market Signals
GIC Housing Finance Ltd has experienced a notable shift in its technical momentum, moving from a sideways trend to a mildly bearish stance as of late June 2026. Despite some bullish signals on weekly charts, monthly indicators suggest caution, reflecting a complex interplay of market forces for this micro-cap housing finance company.
Read full news article Announcements
Announcement under Regulation 30 (LODR)-Change in Management
14-Jul-2026 | Source : BSEChange in Senior Management Personnel
Compliances-Certificate under Reg. 74 (5) of SEBI (DP) Regulations 2018
10-Jul-2026 | Source : BSECertificate under Regulation 74(5) of the SEBI (DP) Regulations 2018 for the quarter ended June 30 2026
Intimation Under Regulation 30 Of The SEBI (Listing Obligations And Disclosure Requirements) Regulations 2015
03-Jul-2026 | Source : BSEIntimation under Regulation 30 of the SEBI (Listing Obligations and Disclosure Requirements) Regulations 2015
Corporate Actions

No Upcoming Board Meetings

GIC Housing Finance Ltd has declared 45% dividend, ex-date: 25 Jun 26

No Splits history available

No Bonus history available

GIC Housing Finance Ltd has announced 1:1 rights issue, ex-date: 13 Mar 06
Quality key factors
Valuation key factors
Technicals key factors
 Technical Indicator Scale: Bearish, Mildly Bearish, Sideways, Mildly Bullish, Bullish Turned
 Shareholding Snapshot : Jun 2026
Shareholding Compare (%holding)
Non Institution
None
Held by 0 Schemes
Held by 31 FIIs (1.4%)
General Insurance Corporation Of India (15.26%)
Life Insurance Corporation Of India (4.59%)
39.6%
Quarterly Results Snapshot (Consolidated) - Mar'26 - YoY

YoY Growth in quarter ended Mar 2026 is 0.38% vs 4.48% in Mar 2025

YoY Growth in quarter ended Mar 2026 is 52.50% vs -34.41% in Mar 2025
Half Yearly Results Snapshot (Consolidated) - Sep'25
Growth in half year ended Sep 2025 is -0.20% vs 0.37% in Sep 2024
Growth in half year ended Sep 2025 is -23.92% vs 21.73% in Sep 2024
Nine Monthly Results Snapshot (Consolidated) - Dec'25
YoY Growth in nine months ended Dec 2025 is 0.28% vs 1.27% in Dec 2024
YoY Growth in nine months ended Dec 2025 is -19.23% vs 28.19% in Dec 2024
Annual Results Snapshot (Consolidated) - Mar'26
YoY Growth in year ended Mar 2026 is 0.31% vs 2.06% in Mar 2025
YoY Growth in year ended Mar 2026 is -3.49% vs 5.99% in Mar 2025
About GIC Housing Finance Ltd

Company Coordinates


