
Compare GK Energy with Similar Stocks
Dashboard
High Management Efficiency with a high ROE of 0%
Strong ability to service debt as the company has a low Debt to EBITDA ratio of 0.67 times
Healthy long term growth as Net Sales has grown by an annual rate of 0% and Operating profit at 0%
Positive results in Mar 26
With ROE of 22.8, it has a Very Attractive valuation with a 3.1 Price to Book Value
Stock DNA
Compressors, Pumps & Diesel Engines
INR 2,827 Cr (Small Cap)
13.00
32
0.00%
-0.27
22.75%
3.18
Total Returns (Price + Dividend) 
GK Energy for the last several years.
Risk Adjusted Returns v/s
Returns Beta

News
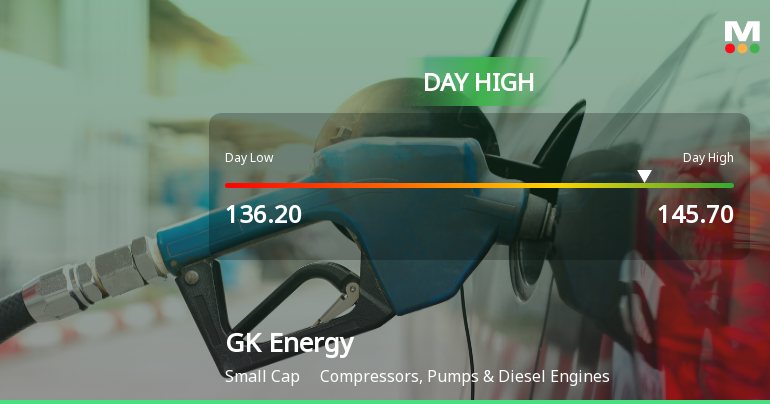
GK Energy Ltd Surges 7.02% to Day's High of Rs 145.7 — Outperforms Sector by 7.4 Percentage Points
The Sensex edged up a modest 0.22% on 09 Jun 2026, while GK Energy Ltd surged 7.02%, touching an intraday high of Rs 145.7. This 7.4-percentage-point outperformance over its sector signals a distinctly stock-specific strength rather than a broad market lift.
Read full news article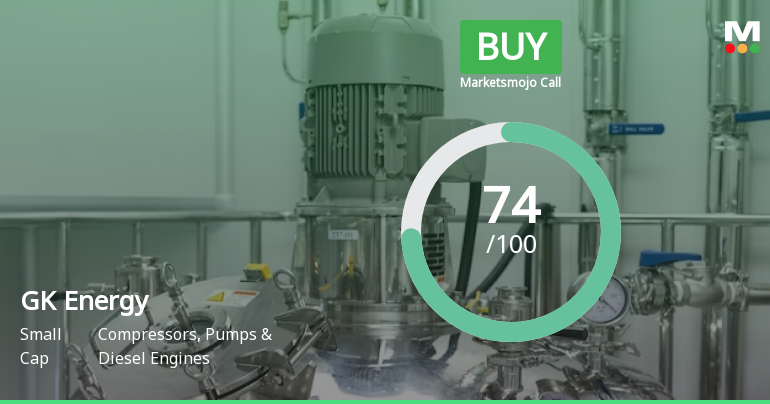
GK Energy Ltd is Rated Buy by MarketsMOJO
GK Energy Ltd is rated 'Buy' by MarketsMOJO, with this rating last updated on 01 June 2026. However, the analysis and financial metrics discussed here reflect the stock's current position as of 08 June 2026, providing investors with the most up-to-date view of the company’s fundamentals, returns, and market standing.
Read full news article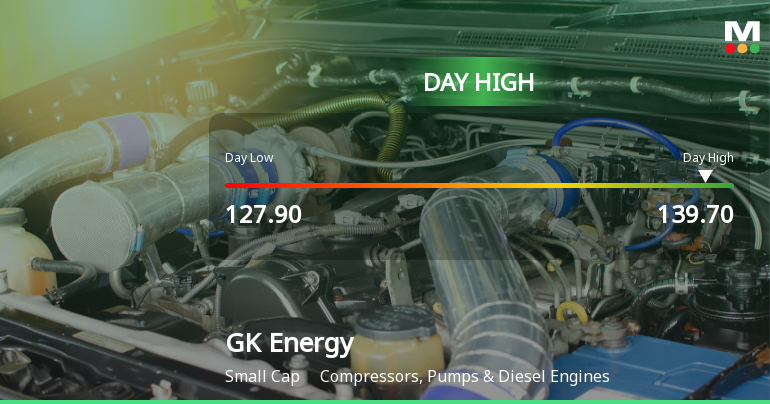
GK Energy Ltd Surges 8.01% to Day's High of Rs 138.8 — Outperforms Sector by 5.94 Percentage Points
The Sensex edged up a modest 0.07% on 4 Jun 2026, while GK Energy Ltd surged 8.01%, touching an intraday high of Rs 138.8. This 5.94-percentage-point outperformance over its sector signals a distinctly stock-specific rally rather than a broad market lift.
Read full news article Announcements
Announcement under Regulation 30 (LODR)-Earnings Call Transcript
19-May-2026 | Source : BSEGK Energy Limited has informed the Exchange about Transcript of the Earnings Conference Call held on May 13 2026.
Announcement under Regulation 30 (LODR)-Newspaper Publication
14-May-2026 | Source : BSEGK Energy Limited has informed the Exchange about Copy of Newspaper Publication of Audited Financial Results for the quarter and financial year ended March 31 2026.
Announcement under Regulation 30 (LODR)-Investor Presentation
13-May-2026 | Source : BSEGK Energy Limited has informed the Exchange about Investor Presentation
Corporate Actions

No Upcoming Board Meetings

No Dividend history available

No Splits history available

No Bonus history available

No Rights history available
Quality key factors
Valuation key factors
Technicals key factors
 Technical Indicator Scale: Bearish, Mildly Bearish, Sideways, Mildly Bullish, Bullish Turned
 Shareholding Snapshot : Mar 2026
Shareholding Compare (%holding)
Promoters
None
Held by 4 Schemes (3.41%)
Held by 5 FIIs (0.79%)
Gopal Rajaram Kabra (76.17%)
Vq Fastercap Fund Ii (1.88%)
8.97%
Quarterly Results Snapshot (Standalone) - Mar'26 - QoQ

QoQ Growth in quarter ended Mar 2026 is -9.05% vs 28.37% in Dec 2025
QoQ Growth in quarter ended Mar 2026 is 0.37% vs 26.63% in Dec 2025
Half Yearly Results Snapshot (Standalone) - Sep'25
Not Applicable: The company has declared_date for only one period
Not Applicable: The company has declared_date for only one period
Nine Monthly Results Snapshot (Standalone) - Dec'25
Not Applicable: The company has declared_date for only one period
Not Applicable: The company has declared_date for only one period
Annual Results Snapshot (Standalone) - Mar'26
YoY Growth in year ended Mar 2026 is 39.98% vs 166.32% in Mar 2025
YoY Growth in year ended Mar 2026 is 51.08% vs 269.13% in Mar 2025
About GK Energy Ltd

Company Coordinates


