Globus Spirits

  • Market Cap: Small Cap
  • Industry: Beverages
  • ISIN: INE615I01010
  • NSEID: GLOBUSSPR
  • BSEID: 533104
INR
818.75
-12.15 (-1.46%)
BSENSE

Sep 18, 03:30 PM

BSE+NSE Vol: 73.53 k

  • Price Points
  • Score
  • Mojo Parameters
  • Total Return
  • News and Corporate Actions
  • Key factors
  • Shareholding
  • Financials
  • CompanyCV
stock-summaryPrice Point
High/Low

1Day

52 Week

Valuation
Technical
Day's Volume

CASH

73.53 k (0.41%) Volume

Shareholding (Aug 2026)

FII

13.77%

Held by 45 FIIs

DII

10.47%

Held by 8 DIIs

Promoter

46.74%

Why is Globus Spirits Ltd falling/rising?

06-Sep-2026

As of 05-Sep, Globus Spirits Ltd's stock price is 915.15, down 0.46%, with a significant drop in investor participation. Despite strong fundamentals and profit growth, the stock has underperformed year-to-date and over the past year, leading to cautious investor sentiment.

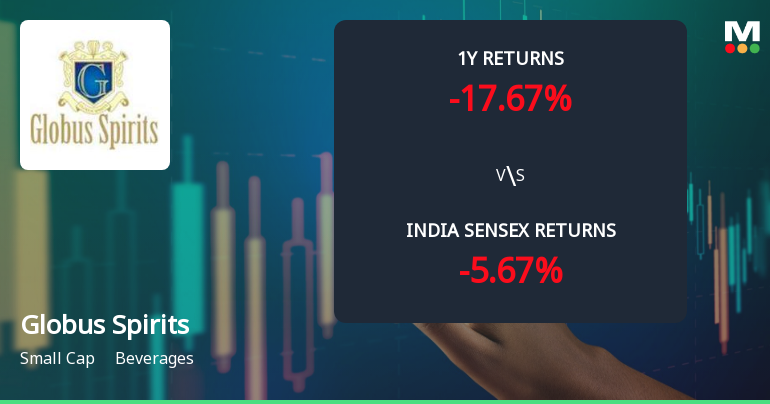
As of 05-Sep, Globus Spirits Ltd's stock price is currently at 915.15, reflecting a decrease of 4.25, or 0.46%. The stock's performance today is inline with the sector, but it has shown a decline in investor participation, with delivery volume falling by 30.95% compared to the 5-day average. <BR><BR>Over the past week, the stock has increased by 0.06%, while the Sensex has decreased by 0.97%. In the last month, Globus Spirits Ltd has outperformed the Sensex, rising by 2.60% compared to the Sensex's decline of 2.44%. However, year-to-date, the stock has fallen by 14.30%, which is more significant than the Sensex's drop of 10.21%. Over the past year, the stock has also decreased by 13.54%, while the Sensex has only fallen by 5.21%. <BR><BR>Despite these declines, the company exhibits strong fundamentals, including a high return on capital employed (ROCE) of 16.41% and a low debt to EBITDA ratio of 2.04 times, indicating a strong ability to service its debt. The company has also reported positive results for the last five consecutive quarters, with significant growth in operating profit and net sales. <BR><BR>However, the stock is trading at a discount compared to its peers, and despite the impressive profit growth of 296.6% over the past year, the stock's overall return has been negative. This combination of strong fundamentals but poor stock performance may contribute to the current downward price movement, as investors may be cautious given the stock's historical performance and recent decline in trading volume.

View full answer

Who are in the management team of Globus Spirits?

01-Sep-2026

The management team of Globus Spirits includes Ajay Kumar Swarup (Managing Director), Bhaskar Roy (Executive Director & COO), Shekhar Swarup (Joint Managing Director), Ruchika Bansal, and Ajay B Baliga (Directors), along with independent directors Vivek Gupta (Chairman), Santosh Kumar Bishwal, Kunal Agarwal, and Sunil Chadha. Santosh Kumar Pattanayak serves as the Company Secretary & Compliance Officer.

The management team of Globus Spirits includes the following members:<BR><BR>1. **Ajay Kumar Swarup** - Managing Director<BR>2. **Bhaskar Roy** - Executive Director & COO<BR>3. **Shekhar Swarup** - Joint Managing Director<BR>4. **Ruchika Bansal** - Director<BR>5. **Ajay B Baliga** - Director<BR><BR>Additionally, the board includes several independent directors:<BR><BR>1. **Santosh Kumar Bishwal** - Independent Director<BR>2. **Kunal Agarwal** - Independent Director<BR>3. **Vivek Gupta** - Chairman & Independent Director<BR>4. **Sunil Chadha** - Independent Director<BR><BR>Lastly, **Santosh Kumar Pattanayak** serves as the Company Secretary & Compliance Officer. This team plays a crucial role in guiding the company's strategic direction and operations.

View full answer

What does Globus Spirits do?

01-Sep-2026

Globus Spirits Ltd is a prominent manufacturer and seller of alcoholic beverages in the Small Cap market, with net sales of ₹789 Cr and a net profit of ₹27 Cr reported for June 2026. The company, originally founded in 1993, has a market cap of ₹2,879 Cr and key financial metrics including a P/E ratio of 29.00 and a debt-equity ratio of 0.42.

Overview:<BR>Globus Spirits Ltd is a leading player in the Alcohol industry, specifically engaged in the manufacture, marketing, and sale of various types of alcoholic beverages, and operates within the Small Cap market segment.<BR><BR>History:<BR>Globus Spirits Ltd was originally incorporated on February 16, 1993, as Globus Agronics Limited and changed its name to Globus Spirits Ltd on January 23, 2007. The most recent quarterly results reported net sales and net profit for June 2026.<BR><BR>Financial Snapshot:<BR>- Net Sales: 789 Cr (Quarterly Results - Jun 2026)<BR>- Net Profit: 27 Cr (Quarterly Results - Jun 2026)<BR>- Market Cap: INR 2,879 Cr (Small Cap)<BR><BR>Key Metrics:<BR>- P/E: 29.00<BR>- Industry P/E: 53<BR>- Dividend Yield: 0.00%<BR>- Debt-Equity: 0.42<BR>- Return on Equity: 8.41%<BR>- Price to Book: 2.64<BR><BR>Contact Details:<BR>Address: F-O Ground Floor Plot No 1 & 2, Ishwar Nagar Mathura Road New Delhi New Delhi : 110065 <BR>Tel: 91-11-66424600 <BR>Email: corpoffice@globusgroup.in <BR>Website: http://www.globusspirits.com

View full answer

Who are the peers of the Globus Spirits?

01-Sep-2026

Globus Spirits' peers include United Spirits, Radico Khaitan, United Breweries, Allied Blenders, Tilaknagar Industries, G M Breweries, Som Distilleries, Assoc. Alcohols, and Sula Vineyards. Radico Khaitan shows the highest growth and return, while Globus Spirits has a good capital structure but a negative 1-year return of -23.91%.

Peers: The peers of Globus Spirits are United Spirits, Radico Khaitan, United Breweries, Allied Blenders, Tilaknagar Inds., G M Breweries, Som Distilleries, Assoc.Alcohols, and Sula Vineyards.<BR><BR>Quality Snapshot: Excellent management risk is observed at United Spirits, Radico Khaitan, United Breweries, Allied Blenders, and Sula Vineyards, while Average management risk is found at Tilaknagar Inds., G M Breweries, Som Distilleries, Assoc.Alcohols, and BCL Industries. Growth is Excellent for Radico Khaitan and Tilaknagar Inds., Good for Allied Blenders and Globus Spirits, and Below Average for United Spirits, United Breweries, G M Breweries, Som Distilleries, Assoc.Alcohols, and Sula Vineyards. Capital Structure is Excellent for United Spirits, Radico Khaitan, United Breweries, G M Breweries, and Assoc.Alcohols, Average for Allied Blenders, Tilaknagar Inds., and BCL Industries, and Good for Globus Spirits.<BR><BR>Return Snapshot: Radico Khaitan has the highest 1-year return at 57.07%, while Som Distilleries has the lowest at -47.14%. Globus Spirits' 1-year return is -23.91%, which is higher than Som Distilleries but lower than Radico Khaitan. Additionally, G M Breweries, Som Distilleries, Assoc.Alcohols, and Sula Vineyards have negative six-month returns.

View full answer

How big is Globus Spirits?

01-Sep-2026

As of 31st August, Globus Spirits Ltd has a market capitalization of 2,879.00 Cr, with recent net sales of 2,799.19 Cr and a net profit of 100.53 Cr. The company reported shareholder's funds of 1,091.37 Cr and total assets of 2,248.51 Cr for the annual period ending in March 2026.

As of 31st August, Globus Spirits Ltd has a market capitalization of 2,879.00 Cr, classifying it as a Small Cap company.<BR><BR>In the latest four quarters, Globus Spirits reported Net Sales of 2,799.19 Cr and a Net Profit of 100.53 Cr.<BR><BR>For the latest annual period ending in March 2026, the company had Shareholder's Funds amounting to 1,091.37 Cr and Total Assets of 2,248.51 Cr.

View full answer

Are Globus Spirits Ltd latest results good or bad?

18-Jul-2026

Globus Spirits Ltd's latest results show strong sales growth with net sales of ₹788.78 crores and a net profit increase of 49.05% year-on-year. However, operating margins have contracted, indicating potential challenges ahead, so investors should remain cautious.

Globus Spirits Ltd's latest results present a mixed picture. On the positive side, the company achieved net sales of ₹788.78 crores in Q1 FY27, reflecting a strong quarter-on-quarter growth of 24.75% and a year-on-year increase of 12.71%. This marks the highest quarterly sales figure in the company's recent history, driven by robust demand across its product portfolio.<BR><BR>Additionally, the net profit for the same quarter was ₹26.59 crores, which is a significant 49.05% increase year-on-year and a 24.60% rise from the previous quarter. This indicates that the company is effectively managing its profitability despite challenges.<BR><BR>However, there are concerns regarding operating margins, which contracted to 9.83% from 10.54% in the previous quarter. This decline raises questions about cost pressures and competitive intensity in the beverages sector. While the company has shown revenue momentum, the margin compression suggests that it may face challenges in maintaining profitability levels in the near term.<BR><BR>Overall, while the sales and profit growth are commendable, the margin pressures indicate that investors should remain cautious and monitor how the company addresses these challenges moving forward.

View full answer

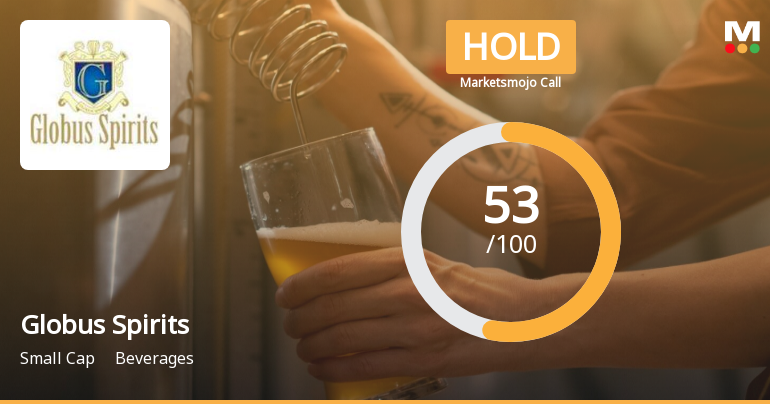
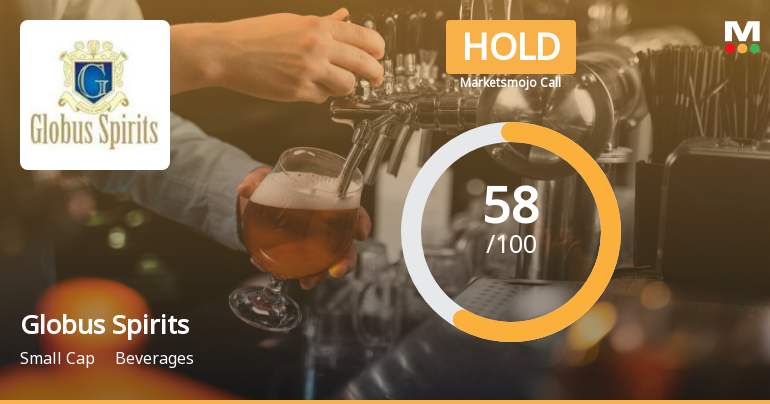
Should I buy, sell or hold Globus Spirits Ltd?

18-Jul-2026

When is the next results date for Globus Spirits Ltd?

31-Dec-2025

The next results date for Globus Spirits Ltd is January 9, 2026.

The next results date for Globus Spirits Ltd is scheduled for January 9, 2026.

View full answer

Is Globus Spirits technically bullish or bearish?

24-Nov-2025

As of November 21, 2025, Globus Spirits shows a mildly bullish trend driven by daily moving averages, despite mixed signals from weekly indicators and Bollinger Bands suggesting caution.

As of 21 November 2025, the technical trend for Globus Spirits has changed from bullish to mildly bullish. The current stance is mildly bullish, primarily driven by the daily moving averages indicating a positive trend. However, the weekly MACD and KST are mildly bearish, suggesting some caution. The Bollinger Bands on a weekly basis are also bearish, which contrasts with the monthly indicators showing bullish tendencies. Overall, while there are mixed signals, the daily timeframe supports a mildly bullish outlook.

View full answer

Is Globus Spirits overvalued or undervalued?

14-Nov-2025

As of November 13, 2025, Globus Spirits is considered very attractive and undervalued, with a high PE ratio of 75.46, a PEG ratio of 0.00 indicating growth potential, and a year-to-date return of 37.29%, significantly outperforming the Sensex's 8.11%.

As of 13 November 2025, the valuation grade for Globus Spirits has moved from attractive to very attractive, indicating a strong positive shift in its perceived value. The company is currently assessed as undervalued based on its financial metrics. Key ratios include a PE ratio of 75.46, an EV to EBITDA of 20.13, and a Price to Book Value of 3.36, which suggest that while the company has a high valuation, it may still present a compelling investment opportunity relative to its peers.<BR><BR>In comparison to its industry peers, Globus Spirits stands out with a significantly higher PE ratio than Varun Beverages at 51.55 and United Spirits at 60.21, both classified as very expensive. The PEG ratio for Globus is notably at 0.00, which indicates potential for growth that is not being reflected in its current price. Additionally, the company's recent stock performance has outpaced the Sensex, with a year-to-date return of 37.29% compared to the Sensex's 8.11%, reinforcing the narrative that Globus Spirits is undervalued in the current market context.

View full answer

How has been the historical performance of Globus Spirits?

13-Nov-2025

Globus Spirits has shown significant growth in net sales, increasing from 932.38 Cr in March 2018 to 2,537.13 Cr in March 2025, but profitability has declined, with profit after tax dropping from 140.82 Cr in March 2021 to 21.92 Cr in March 2025, amid rising raw material costs and increasing debt. Despite these challenges, the book value per share has improved, indicating positive shareholder equity.

Answer:<BR>The historical performance of Globus Spirits shows a fluctuating trend in key financial metrics over the years, with significant growth in net sales and a decline in profitability in recent periods.<BR><BR>Breakdown:<BR>Globus Spirits has experienced a steady increase in net sales, rising from 932.38 Cr in March 2018 to 2,537.13 Cr in March 2025. However, total operating income has also seen a similar upward trend, reaching 2,537.13 Cr in March 2025. The raw material costs have escalated significantly, from 516.60 Cr in March 2018 to 1,803.63 Cr in March 2025, impacting the operating profit, which has decreased from 261.26 Cr in March 2021 to 160.85 Cr in March 2025. Profit before tax has shown a downward trajectory, dropping from 201.77 Cr in March 2021 to 33.24 Cr in March 2025, while profit after tax has similarly declined from 140.82 Cr in March 2021 to 21.92 Cr in March 2025. The company's total liabilities have increased from 769.21 Cr in March 2019 to 2,093.37 Cr in March 2025, indicating a growing debt burden. Despite these challenges, the book value per share has improved from 138.16 in March 2019 to 343.66 in March 2025, reflecting a positive trend in shareholder equity. Cash flow from operating activities has also decreased, from 167.00 Cr in March 2024 to 67.00 Cr in March 2025, while cash flow from investing activities has been negative, indicating ongoing investments. Overall, while Globus Spirits has achieved significant revenue growth, profitability and cash flow have faced pressures in recent years.

View full answer

Who are the top shareholders of the Globus Spirits?

17-Jul-2025

The top shareholders of Globus Spirits include Chandbagh Investments Ltd with 38.84%, mutual funds at 4.35%, foreign institutional investors at 6.35%, and individual investors holding 28.3%. The highest public shareholder is HSBC Value Fund, also at 4.35%.

The top shareholders of Globus Spirits include several key players. The majority of the shares are held by promoters, with Chandbagh Investments Ltd being the largest individual promoter, holding 38.84%. Additionally, mutual funds hold 4.35% of the shares through one scheme, while foreign institutional investors (FIIs) collectively own 6.35% across 37 different FIIs. The highest public shareholder is HSBC Value Fund, which holds 4.35%. Individual investors also have a significant stake, owning 28.3% of the company.

View full answer

Has Globus Spirits declared dividend?

06-Jun-2025

Yes, Globus Spirits Ltd has declared a 35% dividend, amounting to ₹3.5 per share, with an ex-date of August 22, 2024. The total returns over various periods show a mix of performance, with strong long-term gains.

Globus Spirits Ltd has declared a 35% dividend.<BR><BR>Dividend Details:<BR>- Percentage announced: 35%<BR>- Amount per share: 3.5<BR>- Ex-date: 22 Aug 24<BR><BR>Dividend Yield: 0.35%<BR><BR>Total Returns by Period:<BR>In the 6-month period, the price return was 10.24%, with no dividend return, resulting in a total return of 10.24%.<BR><BR>For the 1-year period, the price return was 38.58%, with a dividend return of 0.43%, leading to a total return of 39.01%.<BR><BR>Over the 2-year period, the price return was -10.34%, with a dividend return of 0.28%, resulting in a total return of -10.06%.<BR><BR>In the 3-year period, the price return was 4.32%, with a dividend return of 0.73%, giving a total return of 5.05%.<BR><BR>For the 4-year period, the price return was 183.65%, with a dividend return of 1.37%, resulting in a total return of 185.02%.<BR><BR>In the 5-year period, the price return was 872.84%, with a dividend return of 7.56%, leading to a total return of 880.4%.<BR><BR>Overall, Globus Spirits has declared a significant dividend, and the total returns over various periods show a mix of positive and negative performance, with particularly strong returns in the longer term.

View full answer
iScoreScore
Click here to find our call on this stock
Strong Sell
Sell
Hold
Buy
Strong Buy

Dashboard

1

High Management Efficiency with a high ROCE of 16.41%

 
2

Strong ability to service debt as the company has a low Debt to EBITDA ratio of 2.04 times

 
3

Healthy long term growth as Operating profit has grown by an annual rate 55.20%

 
4

The company has declared Positive results for the last 5 consecutive quarters

5

With ROCE of 10.8, it has a Very Attractive valuation with a 2 Enterprise value to Capital Employed

6

Below par performance in long term as well as near term

stock-summaryMojo Parameters

Mojo Parameters

Loading Valuation Snapshot...

Stock DNA

stock-summary
Industry

Beverages

stock-summary
Market cap

INR 2,611 Cr (Small Cap)

stock-summary
P/E

26.00

stock-summary
Industry P/E

52

stock-summary
Dividend Yield

0.78%

stock-summary
Debt Equity

0.42

stock-summary
Return on Equity

8.41%

stock-summary
Price to Book

2.40

Revenue and Profits:
Net Sales:
789 Cr
(Quarterly Results - Jun 2026)
Net Profit:
27 Cr
stock-summaryTotal Returns
Total Returns (Price + Dividend) stock-summary
Dividend Yield (0.78%)
TimePeriod
Price Return
Dividend Return
Total Return
3 Months
-8.02%
0.72%
-7.3%
6 Months
-6.5%
0.76%
-5.74%
1 Year
-23.38%
0.60%
-22.78%
2 Years
-38.5%
0.75%
-37.75%
3 Years
-9.88%
1.49%
-8.39%
4 Years
-5.48%
1.50%
-3.98%
5 Years
-37.06%
1.14%
-35.92%

Latest dividend: 6.5 per share ex-dividend date: Sep-08-2026

Risk Adjusted Returns v/s stock-summary
Returns Beta
Icon
Beta has not been calculated since enough price history is not available
stock-summaryNews & Corporate Actions

Announcements stock-summary

Shareholder Meeting / Postal Ballot-Scrutinizers Report

16-Sep-2026 | Source : BSE

Scrutinizer Report-2026

Voting Results For The AGM Dated September 15 2026

16-Sep-2026 | Source : BSE

Voting Results for the AGM dated September 15 2026

Shareholder Meeting / Postal Ballot-Outcome of AGM

15-Sep-2026 | Source : BSE

AGM Proceedings 15th September 2026

Corporate Actions stock-summary

stock-summary
BOARD MEETING

No Upcoming Board Meetings

stock-summary
DIVIDEND

Globus Spirits Ltd has declared 65% dividend, ex-date: 08 Sep 26

stock-summary
SPLITS

No Splits history available

stock-summary
BONUS

No Bonus history available

stock-summary
RIGHTS

No Rights history available

stock-summaryKey Factors

Quality key factors stock-summary

Factor
Value
Sales Growth (5y)
6.09%
EBIT Growth (5y)
55.20%
EBIT to Interest (avg)
5.58
Debt to EBITDA (avg)
2.60
Net Debt to Equity (avg)
0.42
Sales to Capital Employed (avg)
1.76
Tax Ratio
24.04%
Dividend Payout Ratio
34.17%
Pledged Shares
0
Institutional Holding
24.24%
ROCE (avg)
7.27%
ROE (avg)
12.96%

Valuation key factors

Factor
Value
P/E Ratio
26
Industry P/E
52
Price to Book Value
2.35
EV to EBIT
16.61
EV to EBITDA
10.85
EV to Capital Employed
1.95
EV to Sales
1.08
PEG Ratio
0.10
Dividend Yield
0.80%
ROCE (Latest)
10.77%
ROE (Latest)
8.41%

Technicals key factors

Indicator
Weekly
Monthly
MACD
Bearish
Bearish
RSI
No Signal
No Signal
Bollinger Bands
Bearish
Bearish
Moving Averages
Bearish (Daily)
KST
Mildly Bullish
Bearish
Dow Theory
Mildly Bearish
Mildly Bearish
OBV
Mildly Bearish
No Trend
stock-summary Technical Indicator Scale: Bearish, Mildly Bearish, Sideways, Mildly Bullish, Bullish  Turned 
stock-summaryShareholding
Shareholding Snapshot : Aug 2026stock-summary
Shareholding Compare (%holding) stock-summary
Majority shareholders

Promoters

Pledged Promoter Holdings

None

Mutual Funds

Held by 4 Schemes (7.56%)

FIIs

Held by 45 FIIs (13.77%)

Promoter with highest holding

Chandbagh Investments Ltd (35.66%)

Highest Public shareholder

Massachusetts Institute Of Technology (6.82%)

Individual Investors Holdings

22.81%

stock-summaryFinancial
[
  {
    "link": "quarterly",
    "btn_text": "All Quarterly Results",
    "header": "Quarterly Results Snapshot (Consolidated) - Jun'26 - QoQ",
    "rhs": [
      {
        "prefix": "Net Sales ",
        "suffix": "QoQ Growth in quarter ended Jun 2026 is 24.75% vs -11.78% in Mar 2026",
        "dir": 1
      },
      {
        "prefix": "Consolidated Net Profit ",
        "suffix": "QoQ Growth in quarter ended Jun 2026 is 24.60% vs -30.38% in Mar 2026",
        "dir": 1
      }
    ],
    "table": {
      "header": [
        "Jun'26",
        "Mar'26",
        "Change(%)"
      ],
      "body": [
        {
          "field": "Net Sales",
          "val1": "788.78",
          "val2": "632.31",
          "chgp": "24.75%",
          "chgp_class": "positive"
        },
        {
          "field": "Operating Profit (PBDIT) excl Other Income",
          "val1": "77.54",
          "val2": "66.62",
          "chgp": "16.39%",
          "chgp_class": "positive"
        },
        {
          "field": "Interest",
          "val1": "15.66",
          "val2": "16.48",
          "chgp": "-4.98%",
          "chgp_class": "positive"
        },
        {
          "field": "Exceptional Items",
          "val1": "0.00",
          "val2": "0.00",
          "chgp": "",
          "chgp_class": "neutral"
        },
        {
          "field": "Consolidate Net Profit",
          "val1": "26.59",
          "val2": "21.34",
          "chgp": "24.60%",
          "chgp_class": "positive"
        },
        {
          "field": "Operating Profit Margin (Excl OI)",
          "val1": "9.83%",
          "val2": "10.54%",
          "chgp": "-0.71%",
          "chgp_class": "negative"
        }
      ]
    }
  },
  {
    "link": "half-yearly",
    "btn_text": "All Half Yearly Results",
    "header": "Half Yearly Results Snapshot (Consolidated) - Sep'25",
    "rhs": [
      {
        "prefix": "Net Sales ",
        "suffix": " Growth in half year ended Sep 2025 is 6.32% vs 12.58% in Sep 2024",
        "dir": -1
      },
      {
        "prefix": "Consolidated Net Profit ",
        "suffix": " Growth in half year ended Sep 2025 is 130.93% vs -66.76% in Sep 2024",
        "dir": 1
      }
    ],
    "table": {
      "header": [
        "Sep'25",
        "Sep'24",
        "Change(%)"
      ],
      "body": [
        {
          "field": "Net Sales",
          "val1": "1,361.19",
          "val2": "1,280.32",
          "chgp": "6.32%",
          "chgp_class": "positive"
        },
        {
          "field": "Operating Profit (PBDIT) excl Other Income",
          "val1": "116.84",
          "val2": "77.23",
          "chgp": "51.29%",
          "chgp_class": "positive"
        },
        {
          "field": "Interest",
          "val1": "28.34",
          "val2": "17.97",
          "chgp": "57.71%",
          "chgp_class": "negative"
        },
        {
          "field": "Exceptional Items",
          "val1": "0.00",
          "val2": "0.00",
          "chgp": "",
          "chgp_class": "neutral"
        },
        {
          "field": "Consolidate Net Profit",
          "val1": "39.79",
          "val2": "17.23",
          "chgp": "130.93%",
          "chgp_class": "positive"
        },
        {
          "field": "Operating Profit Margin (Excl OI)",
          "val1": "8.58%",
          "val2": "6.03%",
          "chgp": "2.55%",
          "chgp_class": "positive"
        }
      ]
    }
  },
  {
    "link": "nine-monthly",
    "btn_text": "All Nine Monthly Results",
    "header": "Nine Monthly Results Snapshot (Consolidated) - Dec'25",
    "rhs": [
      {
        "prefix": "Net Sales ",
        "suffix": "YoY Growth in nine months ended Dec 2025 is 10.39% vs 3.16% in Dec 2024",
        "dir": 1
      },
      {
        "prefix": "Consolidated Net Profit ",
        "suffix": "YoY Growth in nine months ended Dec 2025 is 296.18% vs -81.52% in Dec 2024",
        "dir": 1
      }
    ],
    "table": {
      "header": [
        "Dec'25",
        "Dec'24",
        "Change(%)"
      ],
      "body": [
        {
          "field": "Net Sales",
          "val1": "2,077.93",
          "val2": "1,882.36",
          "chgp": "10.39%",
          "chgp_class": "positive"
        },
        {
          "field": "Operating Profit (PBDIT) excl Other Income",
          "val1": "191.85",
          "val2": "111.50",
          "chgp": "72.06%",
          "chgp_class": "positive"
        },
        {
          "field": "Interest",
          "val1": "41.79",
          "val2": "32.18",
          "chgp": "29.86%",
          "chgp_class": "negative"
        },
        {
          "field": "Exceptional Items",
          "val1": "0.00",
          "val2": "0.00",
          "chgp": "",
          "chgp_class": "neutral"
        },
        {
          "field": "Consolidate Net Profit",
          "val1": "70.44",
          "val2": "17.78",
          "chgp": "296.18%",
          "chgp_class": "positive"
        },
        {
          "field": "Operating Profit Margin (Excl OI)",
          "val1": "9.23%",
          "val2": "5.92%",
          "chgp": "3.31%",
          "chgp_class": "positive"
        }
      ]
    }
  },
  {
    "link": "annual",
    "btn_text": "All Annual Results",
    "header": "Annual Results Snapshot (Consolidated) - Mar'26",
    "rhs": [
      {
        "prefix": "Net Sales ",
        "suffix": "YoY Growth in year ended Mar 2026 is 6.82% vs 5.07% in Mar 2025",
        "dir": 1
      },
      {
        "prefix": "Consolidated Net Profit ",
        "suffix": "YoY Growth in year ended Mar 2026 is 293.44% vs -75.82% in Mar 2025",
        "dir": 1
      }
    ],
    "table": {
      "header": [
        "Mar'26",
        "Mar'25",
        "Change(%)"
      ],
      "body": [
        {
          "field": "Net Sales",
          "val1": "2,710.24",
          "val2": "2,537.13",
          "chgp": "6.82%",
          "chgp_class": "positive"
        },
        {
          "field": "Operating Profit (PBDIT) excl Other Income",
          "val1": "258.46",
          "val2": "151.13",
          "chgp": "71.02%",
          "chgp_class": "positive"
        },
        {
          "field": "Interest",
          "val1": "58.27",
          "val2": "46.00",
          "chgp": "26.67%",
          "chgp_class": "negative"
        },
        {
          "field": "Exceptional Items",
          "val1": "0.00",
          "val2": "0.00",
          "chgp": "",
          "chgp_class": "neutral"
        },
        {
          "field": "Consolidate Net Profit",
          "val1": "91.79",
          "val2": "23.33",
          "chgp": "293.44%",
          "chgp_class": "positive"
        },
        {
          "field": "Operating Profit Margin (Excl OI)",
          "val1": "9.54%",
          "val2": "5.96%",
          "chgp": "3.58%",
          "chgp_class": "positive"
        }
      ]
    }
  }
]

Quarterly Results Snapshot (Consolidated) - Jun'26 - QoQstock-summary

Jun'26
Mar'26
Change(%)
Net Sales
788.78
632.31
24.75%
Operating Profit (PBDIT) excl Other Income
77.54
66.62
16.39%
Interest
15.66
16.48
-4.98%
Exceptional Items
0.00
0.00
Consolidate Net Profit
26.59
21.34
24.60%
Operating Profit Margin (Excl OI)
9.83%
10.54%
-0.71%
Values in Rs Cr.
Direction Arrows
Net Sales

QoQ Growth in quarter ended Jun 2026 is 24.75% vs -11.78% in Mar 2026

Direction Arrows
Consolidated Net Profit

QoQ Growth in quarter ended Jun 2026 is 24.60% vs -30.38% in Mar 2026

Half Yearly Results Snapshot (Consolidated) - Sep'25stock-summary

Sep'25
Sep'24
Change(%)
Net Sales
1,361.19
1,280.32
6.32%
Operating Profit (PBDIT) excl Other Income
116.84
77.23
51.29%
Interest
28.34
17.97
57.71%
Exceptional Items
0.00
0.00
Consolidate Net Profit
39.79
17.23
130.93%
Operating Profit Margin (Excl OI)
8.58%
6.03%
2.55%
Values in Rs Cr.
Direction Arrows
Net Sales

Growth in half year ended Sep 2025 is 6.32% vs 12.58% in Sep 2024

Direction Arrows
Consolidated Net Profit

Growth in half year ended Sep 2025 is 130.93% vs -66.76% in Sep 2024

Nine Monthly Results Snapshot (Consolidated) - Dec'25stock-summary

Dec'25
Dec'24
Change(%)
Net Sales
2,077.93
1,882.36
10.39%
Operating Profit (PBDIT) excl Other Income
191.85
111.50
72.06%
Interest
41.79
32.18
29.86%
Exceptional Items
0.00
0.00
Consolidate Net Profit
70.44
17.78
296.18%
Operating Profit Margin (Excl OI)
9.23%
5.92%
3.31%
Values in Rs Cr.
Direction Arrows
Net Sales

YoY Growth in nine months ended Dec 2025 is 10.39% vs 3.16% in Dec 2024

Direction Arrows
Consolidated Net Profit

YoY Growth in nine months ended Dec 2025 is 296.18% vs -81.52% in Dec 2024

Annual Results Snapshot (Consolidated) - Mar'26stock-summary

Mar'26
Mar'25
Change(%)
Net Sales
2,710.24
2,537.13
6.82%
Operating Profit (PBDIT) excl Other Income
258.46
151.13
71.02%
Interest
58.27
46.00
26.67%
Exceptional Items
0.00
0.00
Consolidate Net Profit
91.79
23.33
293.44%
Operating Profit Margin (Excl OI)
9.54%
5.96%
3.58%
Values in Rs Cr.
Direction Arrows
Net Sales

YoY Growth in year ended Mar 2026 is 6.82% vs 5.07% in Mar 2025

Direction Arrows
Consolidated Net Profit

YoY Growth in year ended Mar 2026 is 293.44% vs -75.82% in Mar 2025

stock-summaryCompany CV
About Globus Spirits Ltd stock-summary
stock-summary
Globus Spirits Ltd
Small Cap
Beverages
Globus Spirits Limited was formerly incorporated on February 16, 1993 as Globus Agronics Limited. The name of the Company was changed from Globus Agronics Ltd to Globus Spirits Ltd with effect from January 23, 2007. The Company is one of the leading players in the Alcohol industry in North India. It is engaged in the business of manufacture, marketing and sale of Industrial Alcohol comprising Rectified Spirit and Extra-Neutral Alcohol, Country Liquor, and Indian Made Foreign Liquor (IMFL).
Company Coordinates stock-summary
Company Details
F-O Ground Floor Plot No 1 & 2, Ishwar Nagar Mathura Road New Delhi New Delhi : 110065
stock-summary
Tel: 91-11-66424600
stock-summary
corpoffice@globusgroup.in
Registrar Details
Link Intime India Pvt Ltd, A-40, 2nd Floor, Naraina Industrial Area , Phase II, Near Batra Banquet Hall, New Delhi