
Compare Globus Spirits with Similar Stocks
Dashboard
High Management Efficiency with a high ROCE of 16.41%
Strong ability to service debt as the company has a low Debt to EBITDA ratio of 2.03 times
Poor long term growth as Operating profit has grown by an annual rate -5.06% of over the last 5 years
The company has declared Positive results for the last 4 consecutive quarters
With ROCE of 10.8, it has a Very Attractive valuation with a 1.9 Enterprise value to Capital Employed
Increasing Participation by Institutional Investors
Total Returns (Price + Dividend) 
Latest dividend: 2.7 per share ex-dividend date: Aug-11-2025
Risk Adjusted Returns v/s
Returns Beta

News
Globus Spirits Ltd is Rated Hold by MarketsMOJO
Globus Spirits Ltd is rated 'Hold' by MarketsMOJO, with this rating last updated on 08 May 2026. However, the analysis and financial metrics discussed here reflect the stock's current position as of 02 June 2026, providing investors with an up-to-date perspective on the company’s performance and outlook.
Read full news article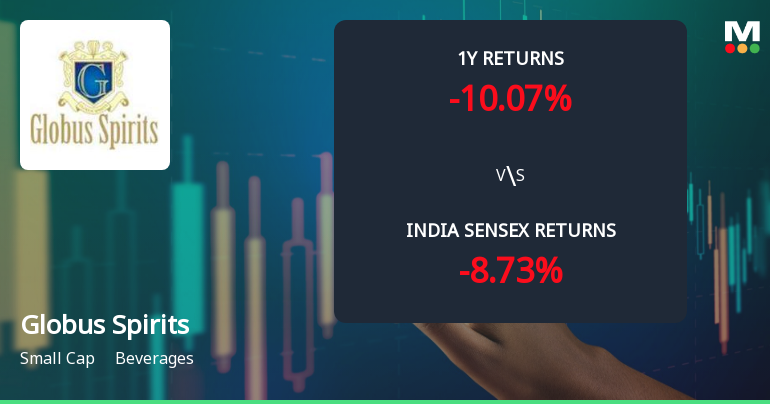
Globus Spirits Ltd Faces Bearish Momentum Amid Technical Downgrade
Globus Spirits Ltd, a small-cap player in the beverages sector, has experienced a notable shift in its technical momentum, with key indicators signalling a bearish trend. The company’s MarketsMOJO grade has been downgraded from Buy to Hold as of 8 May 2026, reflecting growing caution among analysts amid weakening price action and subdued relative strength compared to the broader market.
Read full news article
Globus Spirits Ltd is Rated Hold by MarketsMOJO
Globus Spirits Ltd is rated 'Hold' by MarketsMOJO, with this rating last updated on 08 May 2026. However, the analysis and financial metrics discussed here reflect the stock's current position as of 22 May 2026, providing investors with an up-to-date view of the company’s fundamentals, valuation, financial trends, and technical outlook.
Read full news article Announcements
Announcement under Regulation 30 (LODR)-Analyst / Investor Meet - Intimation
08-Jun-2026 | Source : BSEInvestor Meet intimation 11th June 2026
Announcement under Regulation 30 (LODR)-Analyst / Investor Meet - Intimation
21-May-2026 | Source : BSEIncestor Meeting intimation 27th May 2026
Announcement under Regulation 30 (LODR)-Analyst / Investor Meet - Intimation
15-May-2026 | Source : BSEMeeting intimation 22nd May 2026
Corporate Actions

No Upcoming Board Meetings

Globus Spirits Ltd has declared 27% dividend, ex-date: 11 Aug 25

No Splits history available

No Bonus history available

No Rights history available
Quality key factors
Valuation key factors
Technicals key factors
 Technical Indicator Scale: Bearish, Mildly Bearish, Sideways, Mildly Bullish, Bullish Turned
 Shareholding Snapshot : Mar 2026
Shareholding Compare (%holding)
Promoters
None
Held by 5 Schemes (7.96%)
Held by 39 FIIs (7.53%)
Chandbagh Investments Ltd (38.6%)
Hsbc Mutual Fund - Hsbc Value Fund (4.32%)
23.9%
Quarterly Results Snapshot (Consolidated) - Mar'26 - QoQ

QoQ Growth in quarter ended Mar 2026 is -11.78% vs 8.37% in Dec 2025
QoQ Growth in quarter ended Mar 2026 is -30.38% vs 39.64% in Dec 2025
Half Yearly Results Snapshot (Consolidated) - Sep'25
Growth in half year ended Sep 2025 is 6.32% vs 12.58% in Sep 2024

Growth in half year ended Sep 2025 is 130.93% vs -66.76% in Sep 2024
Nine Monthly Results Snapshot (Consolidated) - Dec'25
YoY Growth in nine months ended Dec 2025 is 10.39% vs 3.16% in Dec 2024
YoY Growth in nine months ended Dec 2025 is 296.18% vs -81.52% in Dec 2024
Annual Results Snapshot (Consolidated) - Mar'26
YoY Growth in year ended Mar 2026 is 6.82% vs 5.07% in Mar 2025
YoY Growth in year ended Mar 2026 is 293.44% vs -75.82% in Mar 2025
About Globus Spirits Ltd

Company Coordinates


