
Compare Go Fashion (I) with Similar Stocks
Stock DNA
Garments & Apparels
INR 1,967 Cr (Small Cap)
33.00
71
0.00%
0.54
8.57%
2.82
Total Returns (Price + Dividend) 
Go Fashion (I) for the last several years.
Risk Adjusted Returns v/s
Returns Beta

News
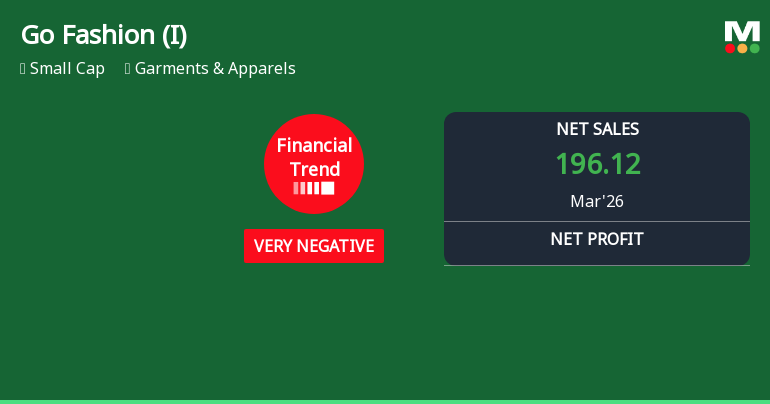
Go Fashion (India) Ltd Reports Continued Financial Struggles Amid Margin Pressure
Go Fashion (India) Ltd reported its quarterly results for March 2026, reflecting a slight improvement in its financial trend despite persistent headwinds. The garment and apparel company’s revenue contracted by 7.3% compared to the previous four-quarter average, while profitability metrics remained under pressure, signalling ongoing operational challenges in a competitive sector.
Read full news article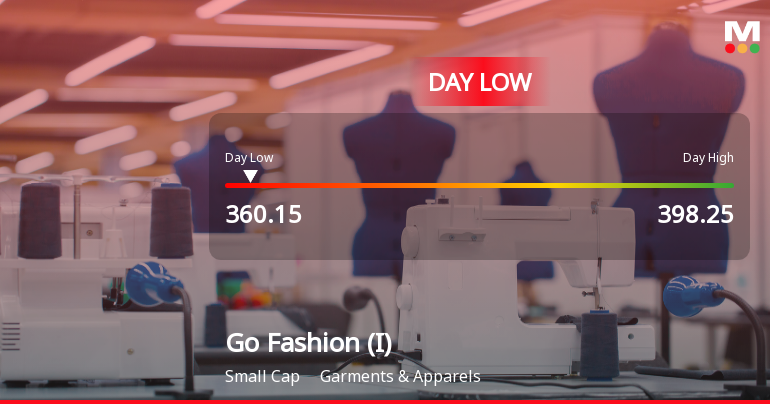
Go Fashion (India) Ltd Hits Intraday Low Amid Price Pressure on 10 Jun 2026
Shares of Go Fashion (India) Ltd declined sharply on 10 Jun 2026, touching an intraday low of Rs 363, reflecting a 7.22% drop as the stock underperformed its sector and broader market indices amid persistent selling pressure.
Read full news article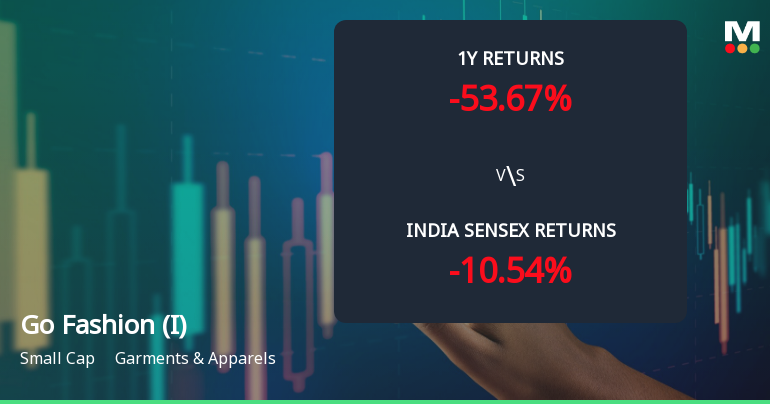
Go Fashion (India) Ltd Faces Technical Setback Amid Mixed Momentum Signals
Go Fashion (India) Ltd, a small-cap player in the garments and apparels sector, has experienced a notable shift in its technical parameters, signalling a transition from a sideways trend to a mildly bearish momentum. Despite recent price declines, the stock’s technical indicators present a complex picture, with some weekly signals showing mild bullishness while monthly trends remain bearish, reflecting ongoing uncertainty in its price trajectory.
Read full news article Announcements
Clarification sought from Go Fashion (India) Ltd
26-May-2026 | Source : BSEThe Exchange has sought clarification from Go Fashion (India) Ltd on May 26 2026 with reference to significant movement in price in order to ensure that investors have latest relevant information about the company and to inform the market so that the interest of the investors is safeguarded.
The reply is awaited.
Clarification On Price Movement
26-May-2026 | Source : BSEClarification on Price Movement
Compliances-Reg.24(A)-Annual Secretarial Compliance
18-May-2026 | Source : BSEAnnual Secretarial Compliance Report for the financial year ending March 31 2026
Corporate Actions

No Upcoming Board Meetings

No Dividend history available

No Splits history available

No Bonus history available

No Rights history available
Quality key factors
Valuation key factors
Technicals key factors
 Technical Indicator Scale: Bearish, Mildly Bearish, Sideways, Mildly Bullish, Bullish Turned
 Shareholding Snapshot : Mar 2026
Shareholding Compare (%holding)
Promoters
24.1567
Held by 9 Schemes (23.32%)
Held by 33 FIIs (4.93%)
Gautam Saraogi (18.88%)
Nippon Life India Trustee Ltd-a/c Nippon India Mul (8.05%)
7.33%
Quarterly Results Snapshot (Standalone) - Mar'26 - QoQ

QoQ Growth in quarter ended Mar 2026 is 0.63% vs -13.06% in Dec 2025
QoQ Growth in quarter ended Mar 2026 is 10.88% vs -67.11% in Dec 2025
Half Yearly Results Snapshot (Standalone) - Sep'25

Growth in half year ended Sep 2025 is 4.29% vs 13.11% in Sep 2024
Growth in half year ended Sep 2025 is -10.59% vs 6.39% in Sep 2024
Nine Monthly Results Snapshot (Standalone) - Dec'25
YoY Growth in nine months ended Dec 2025 is -0.23% vs 10.72% in Dec 2024
YoY Growth in nine months ended Dec 2025 is -30.39% vs 5.57% in Dec 2024
Annual Results Snapshot (Standalone) - Mar'26
YoY Growth in year ended Mar 2026 is -1.20% vs 11.19% in Mar 2025
YoY Growth in year ended Mar 2026 is -36.71% vs 12.95% in Mar 2025
About Go Fashion (India) Ltd

Company Coordinates


