
Compare Godawari Power with Similar Stocks
Dashboard
High Management Efficiency with a high ROE of 23.42%
The company is Net-Debt Free
Poor long term growth as Net Sales has grown by an annual rate of 5.92% and Operating profit at 0.16% over the last 5 years
Flat results in Mar 26
With ROE of 14.3, it has a Very Expensive valuation with a 3.2 Price to Book Value
Majority shareholders : Promoters
Market Beating Performance
Stock DNA
Iron & Steel Products
INR 18,493 Cr (Small Cap)
22.00
26
0.36%
-0.13
14.30%
3.26
Total Returns (Price + Dividend) 
Latest dividend: 1 per share ex-dividend date: Aug-14-2025
Risk Adjusted Returns v/s
Returns Beta

News

Godawari Power & Ispat Ltd is Rated Hold
Godawari Power & Ispat Ltd is rated 'Hold' by MarketsMOJO, with this rating last updated on 21 May 2026. However, the analysis and financial metrics discussed here reflect the stock's current position as of 13 June 2026, providing investors with the latest insights into the company’s performance and outlook.
Read full news article
Godawari Power & Ispat Ltd is Rated Hold
Godawari Power & Ispat Ltd is rated 'Hold' by MarketsMOJO, with this rating last updated on 21 May 2026. However, the analysis and financial metrics discussed here reflect the stock's current position as of 02 June 2026, providing investors with an up-to-date perspective on the company’s fundamentals, valuation, financial trends, and technical outlook.
Read full news article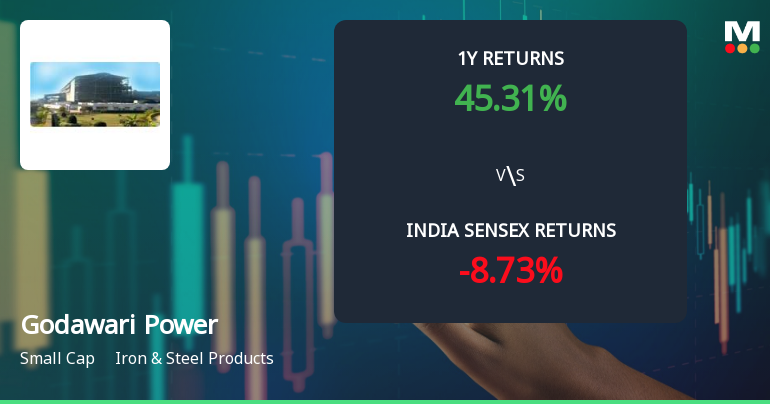
Godawari Power & Ispat Ltd Technical Momentum Shifts Amid Mixed Market Signals
Godawari Power & Ispat Ltd, a small-cap player in the Iron & Steel Products sector, has experienced a notable shift in its technical momentum, moving from a bullish to a mildly bullish trend. This change is underscored by a complex interplay of technical indicators including MACD, RSI, moving averages, and Bollinger Bands, signalling a nuanced outlook for investors as the stock navigates recent price pressures and sector dynamics.
Read full news article Announcements
Announcement under Regulation 30 (LODR)-Analyst / Investor Meet - Intimation
16-Jun-2026 | Source : BSEIntimation under Regulation 30 of LODR regarding participation in conference scheduled to be held in 23.06.2026
Announcement under Regulation 30 (LODR)-Acquisition
05-Jun-2026 | Source : BSEIntimation regarding further investment/Acquisition in Godawari New Energy Private limited a Wholly Owned Subsidiary.
Disclosure Under Regulation 30 Of SEBI(LODR) 2015
05-Jun-2026 | Source : BSEPlease find Disclosure under regulation 30 of SEBI (LODR) 2015 regarding execution of facility agreement for grant of Inter Corporate Loan of Rs. 40 Crores to DGML on 05.06.2026.
Corporate Actions

No Upcoming Board Meetings

Godawari Power & Ispat Ltd has declared 100% dividend, ex-date: 14 Aug 26

Godawari Power & Ispat Ltd has announced 1:5 stock split, ex-date: 04 Oct 24

Godawari Power & Ispat Ltd has announced 1:1 bonus issue, ex-date: 26 Oct 21

No Rights history available
Quality key factors
Valuation key factors
Technicals key factors
 Technical Indicator Scale: Bearish, Mildly Bearish, Sideways, Mildly Bullish, Bullish Turned
 Shareholding Snapshot : Mar 2026
Shareholding Compare (%holding)
Promoters
None
Held by 20 Schemes (1.78%)
Held by 138 FIIs (5.94%)
Vinay Agrawal (5.72%)
None
22.0%
Quarterly Results Snapshot (Consolidated) - Mar'26 - QoQ

QoQ Growth in quarter ended Mar 2026 is 41.32% vs -12.86% in Dec 2025
QoQ Growth in quarter ended Mar 2026 is 95.53% vs -11.27% in Dec 2025
Half Yearly Results Snapshot (Consolidated) - Sep'25
Growth in half year ended Sep 2025 is 0.80% vs -0.25% in Sep 2024

Growth in half year ended Sep 2025 is -15.31% vs -8.64% in Sep 2024
Nine Monthly Results Snapshot (Consolidated) - Dec'25
YoY Growth in nine months ended Dec 2025 is -3.51% vs -0.46% in Dec 2024
YoY Growth in nine months ended Dec 2025 is -11.82% vs -17.66% in Dec 2024
Annual Results Snapshot (Consolidated) - Mar'26
YoY Growth in year ended Mar 2026 is 0.09% vs -1.46% in Mar 2025
YoY Growth in year ended Mar 2026 is -1.35% vs -13.22% in Mar 2025
About Godawari Power & Ispat Ltd

Company Coordinates


