Godawari Power

  • Market Cap: Small Cap
  • Industry: Iron & Steel Products
  • ISIN: INE177H01039
  • NSEID: GPIL
  • BSEID: 532734
INR
237.80
-5.61 (-2.3%)
BSENSE

Sep 02, 01:44 PM

BSE+NSE Vol: 15.59 lacs

  • Price Points
  • Score
  • Mojo Parameters
  • Total Return
  • News and Corporate Actions
  • Key factors
  • Shareholding
  • Financials
  • CompanyCV
stock-summaryPrice Point
High/Low

1Day

52 Week

Valuation
Technical
Day's Volume

CASH

15.59 lacs (68.25%) Volume

Shareholding (Jun 2026)

FII

6.00%

Held by 138 FIIs

DII

3.10%

Held by 16 DIIs

Promoter

63.18%

Why is Godawari Power & Ispat Ltd falling/rising?

02-Sep-2026

As of 01-Sep, Godawari Power & Ispat Ltd's stock price is at 243.20, showing a minor decline but recent gains and increased investor interest. However, concerns about long-term growth, high valuation, and negative financial trends may impact its overall performance.

As of 01-Sep, Godawari Power & Ispat Ltd's stock price is currently at 243.20, reflecting a slight decrease of 0.15 (-0.06%). Despite this minor decline, the stock has shown some positive trends recently, gaining 1.94% over the last three days. This performance is in line with the sector, and the stock has been trading above its 5-day and 20-day moving averages, although it remains below its longer-term moving averages (50-day, 100-day, and 200-day).<BR><BR>Investor participation has increased, with a notable rise in delivery volume by 63.91% compared to the 5-day average, indicating growing interest among investors. Additionally, institutional investors have increased their stake in the company by 0.52% over the previous quarter, now holding 9.1% of the company. This suggests a positive sentiment among more sophisticated investors who have the resources to analyze the company's fundamentals.<BR><BR>However, there are significant concerns that may be contributing to the stock's overall performance. The company has experienced poor long-term growth, with operating profit declining at an annual rate of -6.86% over the last five years. Recent financial results have also shown negative trends, including a substantial increase in interest expenses and a low return on capital employed (ROCE) of 18.80%. Furthermore, the stock is considered to have a very expensive valuation, trading at a price-to-book value of 2.9, which is higher than its peers' average historical valuations.<BR><BR>In summary, while Godawari Power & Ispat Ltd has seen some recent gains and increased investor participation, the underlying issues related to long-term growth and valuation concerns may be contributing to the stock's overall performance and slight decline as of the latest data.

View full answer

Who are in the management team of Godawari Power?

01-Sep-2026

The management team of Godawari Power includes Chairman Shashi Kumar, Executive Directors Bajrangi Lal Agrawal, Dinesh Kumar Agrawal, Abhishek Agrawal, and Vinod Pillai, along with several Independent and Non-Executive Directors. This diverse team combines independent and executive leadership.

The management team of Godawari Power includes the following individuals:<BR><BR>1. **Shashi Kumar** - Chairman & Independent Director<BR>2. **Bhavna Govindbhai Desai** - Independent Non-Executive Director<BR>3. **Raj Kamal Bindal** - Independent Non-Executive Director<BR>4. **Samir Agarwal** - Independent Non-Executive Director<BR>5. **Bajrangi Lal Agrawal** - Executive Director / Managing Director / Promoter<BR>6. **Dinesh Kumar Agrawal** - Executive Director<BR>7. **Abhishek Agrawal** - Executive Director<BR>8. **Vinod Pillai** - Executive Director<BR>9. **Siddharth Agrawal** - Non-Executive Director<BR>10. **Dinesh Kumar Gandhi** - Non-Executive Director<BR><BR>This diverse team brings a mix of independent and executive leadership to the company.

View full answer

What does Godawari Power do?

01-Sep-2026

Godawari Power & Ispat Ltd is a Small Cap company in the Iron & Steel Products industry, incorporated in 1999, with recent quarterly net sales of ₹1,750 Cr and net profit of ₹222 Cr as of June 2026. Key metrics include a P/E ratio of 20.00, a market cap of ₹16,292 Cr, and a return on equity of 14.30%.

Overview:<BR>Godawari Power & Ispat Ltd operates in the Iron & Steel Products industry and is categorized as a Small Cap company.<BR><BR>History:<BR>The company was incorporated in 1999 under the name 'Ispat Godawari Limited' and changed its name to Godawari Power & Ispat Limited on June 20, 2005. The latest quarterly results reported net sales and net profit for June 2026.<BR><BR>Financial Snapshot:<BR>- Net Sales: 1,750 Cr (Quarterly Results - Jun 2026)<BR>- Net Profit: 222 Cr (Quarterly Results - Jun 2026)<BR>- Market Cap: INR 16,292 Cr (Small Cap)<BR><BR>Key Metrics:<BR>- P/E: 20.00<BR>- Industry P/E: 25<BR>- Dividend Yield: 0.42%<BR>- Debt Equity: -0.13<BR>- Return on Equity: 14.30%<BR>- Price to Book: 2.84<BR><BR>Contact Details:<BR>Address: Plot No 428/2 Phase I, Industrial Area Raipur Dist Siltara Chattisgarh : 493111<BR>Tel: 91-771-4082333<BR>Email: corporate@hiragroup.com<BR>Website: http://www.godawaripowerispat.com

View full answer

Who are the peers of the Godawari Power?

01-Sep-2026

Godawari Power's peers include Welspun Corp, APL Apollo Tubes, Shyam Metalics, and others, with varying management and growth risks. In terms of returns, Godawari Power has a 1-year return of 4.71%, lower than Welspun Corp's 182.61% but higher than Gallantt Ispat L's -1.62%.

Peers: The peers of Godawari Power are Welspun Corp, APL Apollo Tubes, Shyam Metalics, Jindal Saw, Ratnamani Metals, Usha Martin, Gallantt Ispat L, Jayaswal Neco, and Mah. Seamless.<BR><BR>Quality Snapshot: Excellent management risk is observed at APL Apollo Tubes, while Good management risk is found at Welspun Corp, Ratnamani Metals, Godawari Power, Usha Martin, and the rest. Average management risk is present at Shyam Metalics, Jindal Saw, Gallantt Ispat L, Jayaswal Neco, and Mah. Seamless. In terms of Growth, Excellent growth is seen at APL Apollo Tubes, while Good growth is noted at Gallantt Ispat L, and the rest have Below Average growth, including Godawari Power, Usha Martin, Shyam Metalics, Jindal Saw, and others. For Capital Structure, Excellent capital structure is found at APL Apollo Tubes, Ratnamani Metals, Godawari Power, Usha Martin, Mah. Seamless, and the rest have Good or Average ratings.<BR><BR>Return Snapshot: The peer with the highest 1-year return is Welspun Corp at 182.61%, while the lowest is Gallantt Ispat L at -1.62%. Godawari Power's 1-year return is 4.71%, which is significantly lower than Welspun Corp's but higher than Gallantt Ispat L's. Additionally, the six-month return is negative for Godawari Power, Gallantt Ispat L, and Jayaswal Neco.

View full answer

How big is Godawari Power?

01-Sep-2026

As of 31st August, Godawari Power & Ispat Ltd has a market capitalization of 16,292.00 Cr, with recent net sales of 5807.87 Cr and a net profit of 806.52 Cr. The company has shareholder's funds of 5,808.16 Cr and total assets of 7,296.15 Cr as of March 2026.

As of 31st August, Godawari Power & Ispat Ltd has a market capitalization of 16,292.00 Cr, categorizing it as a Small Cap company.<BR><BR>In the latest four quarters, Godawari Power reported Net Sales of 5807.87 Cr and a Net Profit of 806.52 Cr.<BR><BR>For the latest annual period ending in March 2026, the company has Shareholder's Funds amounting to 5,808.16 Cr and Total Assets of 7,296.15 Cr.

View full answer

Should I buy, sell or hold Godawari Power & Ispat Ltd?

01-Sep-2026

When is the next results date for Godawari Power & Ispat Ltd?

28-Jul-2026

The next results date for Godawari Power & Ispat Ltd is August 7, 2026.

The next results date for Godawari Power & Ispat Ltd is scheduled for August 7, 2026.

View full answer

Are Godawari Power & Ispat Ltd latest results good or bad?

20-May-2026

Godawari Power & Ispat Ltd's latest results for Q1 2026 are strong, with net sales up 41.32% and net profit rising 95.53% quarter-on-quarter, reflecting robust operational efficiency. However, investors should note that the company's current valuation is considered "very expensive" compared to industry averages.

Godawari Power & Ispat Ltd's latest results for the March 2026 quarter indicate a strong performance, marking a significant turnaround from the previous quarter. Net sales surged by 41.32% quarter-on-quarter to ₹1,610.27 crores, which is the highest quarterly sales in the company's recent history. Additionally, the consolidated net profit rose dramatically by 95.53% QoQ to ₹280.09 crores, reflecting robust operational efficiency and strong pricing power.<BR><BR>The operating profit margins also improved significantly, expanding to 27.26% from 20.17% in the previous quarter, driven by favorable market conditions and effective cost management. Year-on-year, the consolidated net profit grew by 26.59%, showcasing sustained momentum despite challenging industry conditions.<BR><BR>Overall, these results are quite positive, demonstrating Godawari Power's ability to capitalize on market dynamics while maintaining strong operational performance. The company's virtually debt-free balance sheet and strong cash generation further enhance its financial stability and growth prospects. However, investors should be mindful of the company's current valuation, which is considered "very expensive" relative to industry averages.

View full answer

Is Godawari Power technically bullish or bearish?

20-Nov-2025

As of November 19, 2025, Godawari Power's trend is mildly bullish, supported by positive MACD and KST indicators, though tempered by a mildly bearish outlook from the weekly Dow Theory.

As of 19 November 2025, the technical trend for Godawari Power has changed from bullish to mildly bullish. The current stance is mildly bullish, supported by weekly MACD and KST indicators showing bullish signals, while the daily moving averages also indicate a mildly bullish trend. However, the weekly Dow Theory suggests a mildly bearish outlook, which tempers the overall bullish sentiment. The Bollinger Bands are mildly bullish on both weekly and monthly time frames. Despite a recent decline in price, the company has shown strong performance over longer periods, particularly in the 3-year and 5-year returns.

View full answer

How has been the historical performance of Godawari Power?

17-Nov-2025

Godawari Power's historical performance shows fluctuating financial metrics, with net sales peaking at 5,753.04 Cr in March 2023 before declining to 5,375.73 Cr by March 2025, alongside decreasing profits and rising operational costs, despite growth in total assets. Overall, the company has faced profitability challenges amid asset expansion.

Answer:<BR>The historical performance of Godawari Power shows a fluctuating trend in key financial metrics over the years.<BR><BR>Breakdown:<BR>Godawari Power's net sales peaked at 5,753.04 Cr in March 2023 but decreased to 5,375.73 Cr by March 2025. Total operating income followed a similar trend, with a high of 5,753.04 Cr in March 2023, declining to 5,375.73 Cr in March 2025. The raw material costs increased from 1,681.49 Cr in March 2020 to 2,980.43 Cr in March 2025, reflecting rising operational expenses. Operating profit (PBDIT) reached its highest at 1,893.54 Cr in March 2022 but fell to 1,289.69 Cr by March 2025. Profit before tax showed a decline from 1,867.89 Cr in March 2022 to 1,079.81 Cr in March 2025, while profit after tax also decreased from 1,416.74 Cr in March 2022 to 800.77 Cr in March 2025. The company's total assets grew from 3,481.50 Cr in March 2020 to 6,157.22 Cr in March 2025, indicating expansion, although total liabilities also increased from 3,481.50 Cr to 6,157.22 Cr in the same period. Cash flow from operating activities saw a decline from 1,330.00 Cr in March 2022 to 895.00 Cr in March 2025, while net cash inflow improved to 209.00 Cr in March 2025, compared to a net outflow of 387.00 Cr in March 2024. Overall, Godawari Power's financial performance reflects both growth in assets and challenges in profitability over the years.

View full answer

Is Godawari Power overvalued or undervalued?

28-Oct-2025

As of October 27, 2025, Godawari Power is considered very expensive and overvalued with a PE Ratio of 24.45, despite outperforming the Sensex with a 33.36% year-to-date return, while its peers, JSW Steel and Tata Steel, have higher PE Ratios but lower EV to EBITDA ratios, indicating a disconnect between its valuation and earnings potential.

As of 27 October 2025, the valuation grade for Godawari Power has moved from expensive to very expensive, indicating a significant shift in its market perception. The company is currently deemed overvalued. Key ratios include a PE Ratio of 24.45, an EV to EBIT of 18.67, and a Price to Book Value of 3.69, which are notably high compared to its peers.<BR><BR>In comparison, JSW Steel and Tata Steel, both rated as fair, exhibit much higher PE Ratios of 45.78 and 45.43, respectively, while maintaining lower EV to EBITDA ratios at 13.52 and 11.65. This suggests that Godawari Power's valuation is not justified by its earnings potential relative to its peers. Additionally, the company's recent stock performance has significantly outpaced the Sensex, with a year-to-date return of 33.36% compared to the Sensex's 8.50%, further emphasizing the disconnect between its valuation and market fundamentals.

View full answer

Who are the top shareholders of the Godawari Power?

17-Jul-2025

The top shareholders of Godawari Power include promoter Vinay Agrawal with 5.74%, 17 mutual fund schemes with 1.45%, 160 foreign institutional investors holding 6.58%, and individual investors collectively owning 21.98%. There are no pledged promoter holdings or notable public shareholders.

The top shareholders of Godawari Power primarily consist of promoters, with Vinay Agrawal being the promoter with the highest holding at 5.74%. Additionally, the company has 17 mutual fund schemes holding a combined 1.45% and 160 foreign institutional investors (FIIs) holding 6.58%. Individual investors collectively hold 21.98% of the shares. There are no pledged promoter holdings, and there is no notable public shareholder listed.

View full answer

What is the bonus history of the Godawari Power?

06-Jun-2025

Godawari Power & Ispat Ltd announced a 1:1 bonus issue on October 26, 2021, with a record date of October 27, 2021, allowing shareholders to receive one additional share for each share held.

Godawari Power & Ispat Ltd has a recent bonus history that includes a 1:1 bonus issue announced on October 26, 2021. The record date for this bonus was October 27, 2021. This means that shareholders received one additional share for every share they held as of the record date. If you have any more questions about the company or its financial activities, feel free to ask!

View full answer

Has Godawari Power declared dividend?

06-Jun-2025

Yes, Godawari Power & Ispat Ltd has declared a 100% dividend, amounting to ₹1.25 per share, with an ex-date of August 16, 2024. While recent returns have varied, the company has shown substantial long-term growth, particularly a total return of 2819.8% over the past five years.

Godawari Power & Ispat Ltd has declared a 100% dividend.<BR><BR>Dividend Details:<BR>- Percentage announced: 100%<BR>- Amount per share: 1.25<BR>- Ex-date: 16 Aug 24<BR><BR>Dividend Yield: 0.66%.<BR><BR>Total Returns by Period:<BR>In the 6-month period, the price return was -12.72%, with a dividend return of 0%, resulting in a total return of -12.72%.<BR><BR>For the 1-year period, the price return was 0.21%, the dividend return was 0.59%, leading to a total return of 0.8%.<BR><BR>Over the 2-year period, the price return was 159.31%, the dividend return was 5.37%, culminating in a total return of 164.68%.<BR><BR>In the 3-year period, the price return was 229.95%, with a dividend return of 27.98%, resulting in a total return of 257.93%.<BR><BR>For the 4-year period, the price return was 287.16%, the dividend return was 28.86%, leading to a total return of 316.02%.<BR><BR>In the 5-year period, the price return was 2535.37%, with a dividend return of 284.43%, culminating in a total return of 2819.8%.<BR><BR>Overall, Godawari Power has declared a significant dividend, and while recent returns have been mixed, the long-term performance shows substantial growth, particularly over the 5-year period.

View full answer
iScoreScore
Click here to find our call on this stock
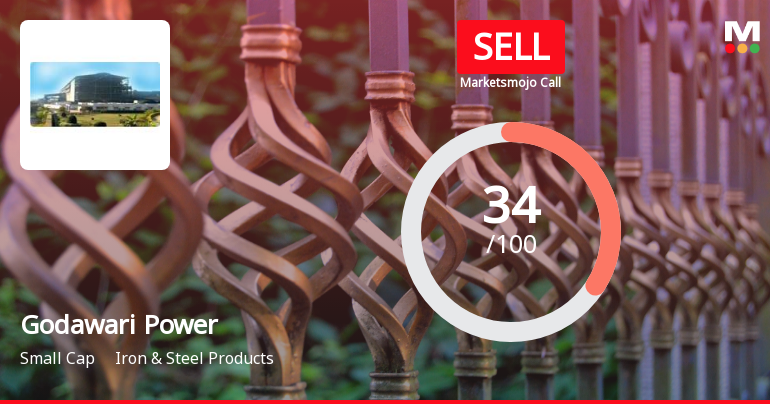
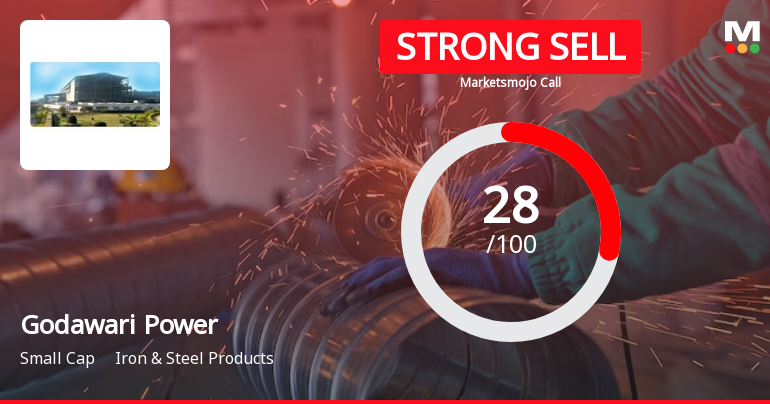
Strong Sell
Sell
Hold
Buy
Strong Buy

Dashboard

1

Poor long term growth as Operating profit has grown by an annual rate -6.86% of over the last 5 years

 
2

Negative results in Jun 26

3

With ROE of 14.3, it has a Very Expensive valuation with a 2.9 Price to Book Value

stock-summaryMojo Parameters

Mojo Parameters

Loading Valuation Snapshot...

Stock DNA

stock-summary
Industry

Iron & Steel Products

stock-summary
Market cap

INR 16,006 Cr (Small Cap)

stock-summary
P/E

20.00

stock-summary
Industry P/E

25

stock-summary
Dividend Yield

0.41%

stock-summary
Debt Equity

-0.13

stock-summary
Return on Equity

14.30%

stock-summary
Price to Book

2.89

Revenue and Profits:
Net Sales:
1,750 Cr
(Quarterly Results - Jun 2026)
Net Profit:
222 Cr
stock-summaryTotal Returns
Total Returns (Price + Dividend) stock-summary
Dividend Yield (0.41%)
TimePeriod
Price Return
Dividend Return
Total Return
3 Months
-16.95%
0.35%
-16.6%
6 Months
-7.22%
0.40%
-6.82%
1 Year
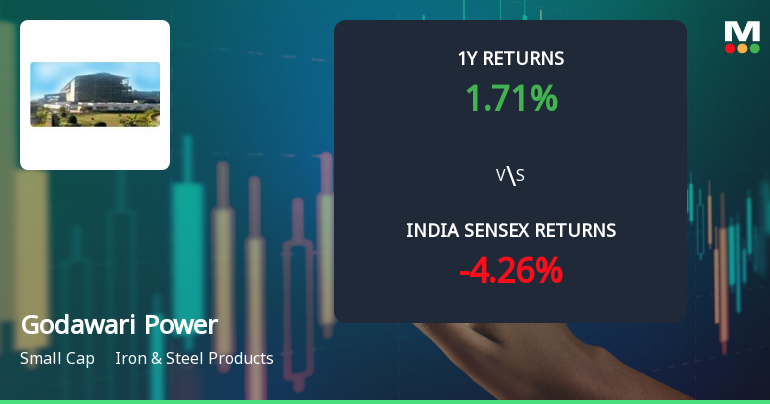
-1.07%
0.42%
-0.65%
2 Years
28.51%
1.09%
29.6%
3 Years
91.3%
1.82%
93.12%
4 Years
311.49%
5.47%
316.96%
5 Years
312.35%
8.11%
320.46%

Latest dividend: 1 per share ex-dividend date: Aug-14-2026

Risk Adjusted Returns v/s stock-summary
Returns Beta
Icon
Beta has not been calculated since enough price history is not available
stock-summaryNews & Corporate Actions

Announcements stock-summary

Godawari Power And Ispat limited - Updates

14-Nov-2019 | Source : NSE

Godawari Power And Ispat limited has informed the Exchange regarding 'Publication of Unaudited Financial Results for the Quarter and Half year ended 30.09.2019'.

Godawari Power And Ispat limited - Limited Review Report

13-Nov-2019 | Source : NSE

Godawari Power And Ispat limited has informed the Exchange regarding Limited Review Report for the Quarter ended September 30, 2019

Godawari Power And Ispat limited - Updates

05-Nov-2019 | Source : NSE

Godawari Power And Ispat limited has informed the Exchange regarding 'Publication of Notice of Board Meeting Scheduled to be held on 12.11.2019'.

Corporate Actions stock-summary

stock-summary
BOARD MEETING

No Upcoming Board Meetings

stock-summary
DIVIDEND

Godawari Power & Ispat Ltd has declared 100% dividend, ex-date: 14 Aug 26

stock-summary
SPLITS

Godawari Power & Ispat Ltd has announced 1:5 stock split, ex-date: 04 Oct 24

stock-summary
BONUS

Godawari Power & Ispat Ltd has announced 1:1 bonus issue, ex-date: 26 Oct 21

stock-summary
RIGHTS

No Rights history available

stock-summaryKey Factors

Quality key factors stock-summary

Factor
Value
Sales Growth (5y)
5.14%
EBIT Growth (5y)
-6.86%
EBIT to Interest (avg)
25.73
Debt to EBITDA (avg)
0.19
Net Debt to Equity (avg)
-0.13
Sales to Capital Employed (avg)
1.25
Tax Ratio
27.21%
Dividend Payout Ratio
16.99%
Pledged Shares
0
Institutional Holding
9.10%
ROCE (avg)
34.50%
ROE (avg)
23.42%

Valuation key factors

Factor
Value
P/E Ratio
20
Industry P/E
25
Price to Book Value
2.89
EV to EBIT
14.58
EV to EBITDA
12.45
EV to Capital Employed
3.17
EV to Sales
2.71
PEG Ratio
2.00
Dividend Yield
0.41%
ROCE (Latest)
21.68%
ROE (Latest)
14.30%

Technicals key factors

Indicator
Weekly
Monthly
MACD
Bearish
Mildly Bearish
RSI
No Signal
No Signal
Bollinger Bands
Mildly Bearish
Mildly Bullish
Moving Averages
Bearish (Daily)
KST
Bearish
Mildly Bearish
Dow Theory
Mildly Bullish
No Trend
OBV
Mildly Bullish
No Trend
stock-summary Technical Indicator Scale: Bearish, Mildly Bearish, Sideways, Mildly Bullish, Bullish  Turned 
stock-summaryShareholding
Shareholding Snapshot : Jun 2026stock-summary
Shareholding Compare (%holding) stock-summary
Majority shareholders

Promoters

Pledged Promoter Holdings

None

Mutual Funds

Held by 20 Schemes (2.35%)

FIIs

Held by 138 FIIs (6.0%)

Promoter with highest holding

Vinay Agrawal (5.7%)

Highest Public shareholder

Bandhan Small Cap Fund (1.24%)

Individual Investors Holdings

21.43%

stock-summaryFinancial
[
  {
    "link": "quarterly",
    "btn_text": "All Quarterly Results",
    "header": "Quarterly Results Snapshot (Consolidated) - Jun'26 - QoQ",
    "rhs": [
      {
        "prefix": "Net Sales ",
        "suffix": "QoQ Growth in quarter ended Jun 2026 is 8.71% vs 41.32% in Mar 2026",
        "dir": -1
      },
      {
        "prefix": "Consolidated Net Profit ",
        "suffix": "QoQ Growth in quarter ended Jun 2026 is -20.83% vs 95.53% in Mar 2026",
        "dir": -1
      }
    ],
    "table": {
      "header": [
        "Jun'26",
        "Mar'26",
        "Change(%)"
      ],
      "body": [
        {
          "field": "Net Sales",
          "val1": "1,750.47",
          "val2": "1,610.27",
          "chgp": "8.71%",
          "chgp_class": "positive"
        },
        {
          "field": "Operating Profit (PBDIT) excl Other Income",
          "val1": "333.73",
          "val2": "439.01",
          "chgp": "-23.98%",
          "chgp_class": "negative"
        },
        {
          "field": "Interest",
          "val1": "20.33",
          "val2": "19.45",
          "chgp": "4.52%",
          "chgp_class": "negative"
        },
        {
          "field": "Exceptional Items",
          "val1": "0.00",
          "val2": "-18.29",
          "chgp": "100.00%",
          "chgp_class": "positive"
        },
        {
          "field": "Consolidate Net Profit",
          "val1": "221.74",
          "val2": "280.09",
          "chgp": "-20.83%",
          "chgp_class": "negative"
        },
        {
          "field": "Operating Profit Margin (Excl OI)",
          "val1": "19.07%",
          "val2": "27.26%",
          "chgp": "-8.19%",
          "chgp_class": "negative"
        }
      ]
    }
  },
  {
    "link": "half-yearly",
    "btn_text": "All Half Yearly Results",
    "header": "Half Yearly Results Snapshot (Consolidated) - Sep'25",
    "rhs": [
      {
        "prefix": "Net Sales ",
        "suffix": " Growth in half year ended Sep 2025 is 0.80% vs -0.25% in Sep 2024",
        "dir": 1
      },
      {
        "prefix": "Consolidated Net Profit ",
        "suffix": " Growth in half year ended Sep 2025 is -15.31% vs -8.64% in Sep 2024",
        "dir": -1
      }
    ],
    "table": {
      "header": [
        "Sep'25",
        "Sep'24",
        "Change(%)"
      ],
      "body": [
        {
          "field": "Net Sales",
          "val1": "2,630.93",
          "val2": "2,610.05",
          "chgp": "0.80%",
          "chgp_class": "positive"
        },
        {
          "field": "Operating Profit (PBDIT) excl Other Income",
          "val1": "584.23",
          "val2": "654.26",
          "chgp": "-10.70%",
          "chgp_class": "negative"
        },
        {
          "field": "Interest",
          "val1": "26.49",
          "val2": "27.71",
          "chgp": "-4.40%",
          "chgp_class": "positive"
        },
        {
          "field": "Exceptional Items",
          "val1": "0.00",
          "val2": "0.69",
          "chgp": "-100.00%",
          "chgp_class": "negative"
        },
        {
          "field": "Consolidate Net Profit",
          "val1": "377.40",
          "val2": "445.63",
          "chgp": "-15.31%",
          "chgp_class": "negative"
        },
        {
          "field": "Operating Profit Margin (Excl OI)",
          "val1": "22.21%",
          "val2": "25.07%",
          "chgp": "-2.86%",
          "chgp_class": "negative"
        }
      ]
    }
  },
  {
    "link": "nine-monthly",
    "btn_text": "All Nine Monthly Results",
    "header": "Nine Monthly Results Snapshot (Consolidated) - Dec'25",
    "rhs": [
      {
        "prefix": "Net Sales ",
        "suffix": "YoY Growth in nine months ended Dec 2025 is -3.51% vs -0.46% in Dec 2024",
        "dir": -1
      },
      {
        "prefix": "Consolidated Net Profit ",
        "suffix": "YoY Growth in nine months ended Dec 2025 is -11.82% vs -17.66% in Dec 2024",
        "dir": 1
      }
    ],
    "table": {
      "header": [
        "Dec'25",
        "Dec'24",
        "Change(%)"
      ],
      "body": [
        {
          "field": "Net Sales",
          "val1": "3,770.38",
          "val2": "3,907.65",
          "chgp": "-3.51%",
          "chgp_class": "negative"
        },
        {
          "field": "Operating Profit (PBDIT) excl Other Income",
          "val1": "814.07",
          "val2": "875.41",
          "chgp": "-7.01%",
          "chgp_class": "negative"
        },
        {
          "field": "Interest",
          "val1": "39.01",
          "val2": "40.41",
          "chgp": "-3.46%",
          "chgp_class": "positive"
        },
        {
          "field": "Exceptional Items",
          "val1": "0.00",
          "val2": "0.69",
          "chgp": "-100.00%",
          "chgp_class": "negative"
        },
        {
          "field": "Consolidate Net Profit",
          "val1": "520.65",
          "val2": "590.41",
          "chgp": "-11.82%",
          "chgp_class": "negative"
        },
        {
          "field": "Operating Profit Margin (Excl OI)",
          "val1": "21.59%",
          "val2": "22.40%",
          "chgp": "-0.81%",
          "chgp_class": "negative"
        }
      ]
    }
  },
  {
    "link": "annual",
    "btn_text": "All Annual Results",
    "header": "Annual Results Snapshot (Consolidated) - Mar'26",
    "rhs": [
      {
        "prefix": "Net Sales ",
        "suffix": "YoY Growth in year ended Mar 2026 is 0.09% vs -1.46% in Mar 2025",
        "dir": 1
      },
      {
        "prefix": "Consolidated Net Profit ",
        "suffix": "YoY Growth in year ended Mar 2026 is -1.35% vs -13.22% in Mar 2025",
        "dir": 1
      }
    ],
    "table": {
      "header": [
        "Mar'26",
        "Mar'25",
        "Change(%)"
      ],
      "body": [
        {
          "field": "Net Sales",
          "val1": "5,380.65",
          "val2": "5,375.73",
          "chgp": "0.09%",
          "chgp_class": "positive"
        },
        {
          "field": "Operating Profit (PBDIT) excl Other Income",
          "val1": "1,253.07",
          "val2": "1,193.71",
          "chgp": "4.97%",
          "chgp_class": "positive"
        },
        {
          "field": "Interest",
          "val1": "58.46",
          "val2": "55.39",
          "chgp": "5.54%",
          "chgp_class": "negative"
        },
        {
          "field": "Exceptional Items",
          "val1": "-18.29",
          "val2": "0.70",
          "chgp": "-2,712.86%",
          "chgp_class": "negative"
        },
        {
          "field": "Consolidate Net Profit",
          "val1": "800.75",
          "val2": "811.67",
          "chgp": "-1.35%",
          "chgp_class": "negative"
        },
        {
          "field": "Operating Profit Margin (Excl OI)",
          "val1": "23.29%",
          "val2": "22.21%",
          "chgp": "1.08%",
          "chgp_class": "positive"
        }
      ]
    }
  }
]

Quarterly Results Snapshot (Consolidated) - Jun'26 - QoQstock-summary

Jun'26
Mar'26
Change(%)
Net Sales
1,750.47
1,610.27
8.71%
Operating Profit (PBDIT) excl Other Income
333.73
439.01
-23.98%
Interest
20.33
19.45
4.52%
Exceptional Items
0.00
-18.29
100.00%
Consolidate Net Profit
221.74
280.09
-20.83%
Operating Profit Margin (Excl OI)
19.07%
27.26%
-8.19%
Values in Rs Cr.
Direction Arrows
Net Sales

QoQ Growth in quarter ended Jun 2026 is 8.71% vs 41.32% in Mar 2026

Direction Arrows
Consolidated Net Profit

QoQ Growth in quarter ended Jun 2026 is -20.83% vs 95.53% in Mar 2026

Half Yearly Results Snapshot (Consolidated) - Sep'25stock-summary

Sep'25
Sep'24
Change(%)
Net Sales
2,630.93
2,610.05
0.80%
Operating Profit (PBDIT) excl Other Income
584.23
654.26
-10.70%
Interest
26.49
27.71
-4.40%
Exceptional Items
0.00
0.69
-100.00%
Consolidate Net Profit
377.40
445.63
-15.31%
Operating Profit Margin (Excl OI)
22.21%
25.07%
-2.86%
Values in Rs Cr.
Direction Arrows
Net Sales

Growth in half year ended Sep 2025 is 0.80% vs -0.25% in Sep 2024

Direction Arrows
Consolidated Net Profit

Growth in half year ended Sep 2025 is -15.31% vs -8.64% in Sep 2024

Nine Monthly Results Snapshot (Consolidated) - Dec'25stock-summary

Dec'25
Dec'24
Change(%)
Net Sales
3,770.38
3,907.65
-3.51%
Operating Profit (PBDIT) excl Other Income
814.07
875.41
-7.01%
Interest
39.01
40.41
-3.46%
Exceptional Items
0.00
0.69
-100.00%
Consolidate Net Profit
520.65
590.41
-11.82%
Operating Profit Margin (Excl OI)
21.59%
22.40%
-0.81%
Values in Rs Cr.
Direction Arrows
Net Sales

YoY Growth in nine months ended Dec 2025 is -3.51% vs -0.46% in Dec 2024

Direction Arrows
Consolidated Net Profit

YoY Growth in nine months ended Dec 2025 is -11.82% vs -17.66% in Dec 2024

Annual Results Snapshot (Consolidated) - Mar'26stock-summary

Mar'26
Mar'25
Change(%)
Net Sales
5,380.65
5,375.73
0.09%
Operating Profit (PBDIT) excl Other Income
1,253.07
1,193.71
4.97%
Interest
58.46
55.39
5.54%
Exceptional Items
-18.29
0.70
-2,712.86%
Consolidate Net Profit
800.75
811.67
-1.35%
Operating Profit Margin (Excl OI)
23.29%
22.21%
1.08%
Values in Rs Cr.
Direction Arrows
Net Sales

YoY Growth in year ended Mar 2026 is 0.09% vs -1.46% in Mar 2025

Direction Arrows
Consolidated Net Profit

YoY Growth in year ended Mar 2026 is -1.35% vs -13.22% in Mar 2025

stock-summaryCompany CV
About Godawari Power & Ispat Ltd stock-summary
stock-summary
Godawari Power & Ispat Ltd
Small Cap
Iron & Steel Products
Godawari Power & Ispat Limited (GPIL) was formerly incorporated with the name of ' Ispat Godawari Limited' on September 21, 1999. The name of the Company was changed from Ispat Godawari Limited to Godawari Power & Ispat Limited on June 20, 2005. Company is stewarded by Mr. B.L. Agrawal, a first-generation entrepreneur, who possesses more than four decades of experience in the steel industry.
Company Coordinates stock-summary
Company Details
Plot No 428/2 Phase I, Industrial Area Raipur Dist Siltara Chattisgarh : 493111
stock-summary
Tel: 91-771-4082333
stock-summary
corporate@hiragroup.com
Registrar Details
Link Intime India Pvt Ltd, C-13 Pannalal Silk Compound, L B S Marg, Bhandup , Mumbai