Goodyear India

  • Market Cap: Small Cap
  • Industry: Tyres & Rubber Products
  • ISIN: INE533A01012
  • NSEID: GOODYEAR
  • BSEID: 500168
INR
843.70
50.65 (6.39%)
BSENSE

Feb 06

BSE+NSE Vol: 65.42 k

  • Price Points
  • Score
  • Mojo Parameters
  • Total Return
  • News and Corporate Actions
  • Key factors
  • Shareholding
  • Financials
  • CompanyCV
stock-summaryPrice Point
High/Low

1Day

52 Week

Valuation
Technical
Day's Volume

CASH

65.42 k (391.50%) Volume

Shareholding (Dec 2025)

FII

0.34%

Held by 6 FIIs

DII

0.08%

Held by 8 DIIs

Promoter

74.00%

Has Goodyear India declared dividend?

06-Jun-2025

Goodyear India Ltd has declared a 150% dividend, amounting to ₹15 per share, with an ex-date of July 23, 2024. While the dividend yield is 1.62%, total returns have been mixed, showing negative performance in the short term but positive returns over the longer term.

Goodyear India Ltd has declared a 150% dividend.<BR><BR>Dividend Details:<BR>- Percentage announced: 150%<BR>- Amount per share: 15<BR>- Ex-date: 23 Jul 24<BR><BR>Dividend Yield: 1.62%.<BR><BR>Total Returns by Period:<BR>In the last 6 months, the price return was -9.35%, with a dividend return of 0%, resulting in a total return of -9.35%.<BR><BR>Over the past year, the price return was -18.77%, the dividend return was 1.29%, leading to a total return of -17.48%.<BR><BR>In the last 2 years, the price return was -22.26%, the dividend return was 5.64%, culminating in a total return of -16.62%.<BR><BR>For the 3-year period, the price return was -7.82%, with a dividend return of 14.63%, resulting in a total return of 6.81%.<BR><BR>In the past 4 years, the price return was -4.71%, the dividend return was 15.34%, leading to a total return of 10.63%.<BR><BR>Over the last 5 years, the price return was 25.31%, with a dividend return of 33.28%, resulting in a total return of 58.59%.<BR><BR>Overall, while Goodyear India has declared a significant dividend, the total returns over various periods show a mixed performance, with negative returns in the shorter terms but positive returns over the longer term. The dividend yield indicates a modest return from dividends relative to the stock price.

View full answer

Who are the peers of the Goodyear India?

03-Jun-2025

Goodyear India's peers include MRF, Balkrishna Industries, Apollo Tyres, CEAT, JK Tyre & Industries, Tolins Tyres, Indag Rubber, Modi Rubber, and Dolfin Rubbers. In terms of management risk, growth, and capital structure, Goodyear India ranks average to good, with a 1-year return of -18.73%.

Peers: The peers of Goodyear India are MRF, Balkrishna Inds, Apollo Tyres, CEAT, JK Tyre & Indust, Tolins Tyres, Indag Rubber, Modi Rubber, and Dolfin Rubbers.<BR><BR>Quality Snapshot: Excellent management risk is observed at MRF and Balkrishna Inds, while Good management risk is found at Apollo Tyres, CEAT, JK Tyre & Indust, Goodyear India, and Dolfin Rubbers, and Average management risk is present at Tolins Tyres and Indag Rubber. Growth is Excellent at Apollo Tyres, Good at MRF, CEAT, and Tolins Tyres, Average at Balkrishna Inds, JK Tyre & Indust, and Indag Rubber, and Below Average at Goodyear India, Modi Rubber, and Dolfin Rubbers. Excellent capital structure is noted at MRF and Goodyear India, while Excellent capital structure is found at Balkrishna Inds, Good at Apollo Tyres, Tolins Tyres, and Indag Rubber, Average at CEAT, and Below Average at JK Tyre & Indust, Modi Rubber, and Dolfin Rubbers.<BR><BR>Return Snapshot: The peer with the highest 1-year return is Modi Rubber at 36.90%, while Balkrishna Inds has the lowest at -19.77%. Goodyear India's 1-year return is -18.73%, which is higher than Balkrishna Inds but lower than Modi Rubber. Additionally, several peers, including JK Tyre & Indust, Balkrishna Inds, and Indag Rubber, have negative six-month returns.

View full answer

Who are in the management team of Goodyear India?

16-Jul-2025

As of March 2023, the management team of Goodyear India includes Sandeep Mahajan (Chairman & Managing Director), Manish Manakchand Mundra (Whole Time Director & CFO), and several independent directors, including Sudha Ravi and Rajiv Lochan Jain. They oversee the company's operations and strategic direction.

As of March 2023, the management team of Goodyear India includes the following individuals:<BR><BR>1. Sudha Ravi - Independent Director<BR>2. Rajiv Lochan Jain - Independent Director<BR>3. Nicole Amanda Nuttall - Director<BR>4. Rajeev Kher - Independent Director<BR>5. Sandeep Mahajan - Chairman & Managing Director<BR>6. Manish Manakchand Mundra - Whole Time Director & CFO<BR>7. Anup Karnwal - Company Secretary & Compliance Officer<BR><BR>This team is responsible for overseeing the operations and strategic direction of the company.

View full answer

What does Goodyear India do?

17-Jul-2025

Goodyear India Ltd manufactures tyres and rubber products for the automobile industry and reported net sales of ₹6,027 Cr and a net profit of ₹49 Cr for the quarter ending March 2025. The company operates in the Small Cap category with a market cap of ₹2,445 Cr.

Overview:<BR>Goodyear India Ltd manufactures tyres and rubber goods for the automobile industry and operates within the Small Cap category in the Tyres & Rubber Products industry.<BR><BR>History:<BR>Goodyear India Ltd was incorporated as 'Goodyear Tire and Rubber Company (India) Limited' and acquired its current name in 1961 when it became a public limited company. The latest quarterly results reported net sales and profit for the period ending March 2025.<BR><BR>Financial Snapshot:<BR>Net Sales: 6,027 Cr (Quarterly Results - Mar 2025) <BR>Net Profit: 49 Cr (Quarterly Results - Mar 2025) <BR>Market Cap: INR 2,445 Cr (Small Cap)<BR><BR>Key Metrics:<BR>P/E: 44.00 <BR>Industry P/E: 30 <BR>Dividend Yield: 1.43% <BR>Debt Equity: -0.27 <BR>Return on Equity: 9.14% <BR>Price to Book: 4.02 <BR><BR>Contact Details:<BR>Address: Mathura Road, Ballabgarh Faridabad Haryana : 121004 <BR>Tel: 91-129-6611000 <BR>Email: goodyearindia_investorcell@goodyear <BR>Website: http://www.goodyear.co.in

View full answer

Who are the top shareholders of the Goodyear India?

17-Jul-2025

The top shareholders of Goodyear India are Goodyear Orient Company (Private) Limited, holding 74.0%, and HDFC Small Cap Fund, the largest public shareholder with 6.75%. Individual investors own about 13.08%, while foreign institutional investors hold approximately 0.59%.

The top shareholders of Goodyear India include Goodyear Orient Company (Private) Limited, which holds a significant 74.0% of the shares, making it the largest promoter. Additionally, HDFC Small Cap Fund is the highest public shareholder with a holding of 6.75%. The company also has individual investors holding approximately 13.08% of the shares, while foreign institutional investors (FIIs) collectively hold about 0.59% through 24 different entities. There are no pledged promoter holdings reported.

View full answer

Is Goodyear India overvalued or undervalued?

25-Jul-2025

As of July 24, 2025, Goodyear India is considered very expensive and overvalued with a PE ratio of 41.05 and a current price of 980.90, especially compared to its peers like MRF and Apollo Tyres, while also underperforming the market with a year-to-date return of -2.38%.

As of 24 July 2025, the valuation grade for Goodyear India has moved from expensive to very expensive. The company is currently overvalued based on its financial ratios, with a PE ratio of 41.05, a Price to Book Value of 3.75, and an EV to EBITDA of 17.99. In comparison to its peers, MRF has a PE ratio of 34.15 and an EV to EBITDA of 15.62, while Apollo Tyres is more attractively valued with a PE ratio of 23.45 and an EV to EBITDA of 9.14.<BR><BR>The company's recent stock performance has been underwhelming, with a year-to-date return of -2.38%, contrasting sharply with the Sensex's gain of 5.18% during the same period. Given the high valuation metrics and the performance relative to peers and the broader market, Goodyear India appears to be overvalued at its current price of 980.90.

View full answer

How big is Goodyear India?

24-Jul-2025

As of 24th July, Goodyear India Ltd has a market capitalization of 2,272.00 Cr, with net sales of 2,608.05 Cr and a net profit of 55.12 Cr over the latest four quarters. The company has shareholder's funds of 602.95 Cr and total assets of 1,243.71 Cr.

As of 24th July, Goodyear India Ltd has a market capitalization of 2,272.00 Cr, classifying it as a Small Cap company.<BR><BR>In the latest four quarters, Goodyear India reported net sales of 2,608.05 Cr and a net profit of 55.12 Cr.<BR><BR>For the latest annual period, the company has shareholder's funds amounting to 602.95 Cr and total assets of 1,243.71 Cr.

View full answer

How has been the historical performance of Goodyear India?

02-Dec-2025

Goodyear India's historical performance has shown fluctuating net sales and profits, peaking at INR 2,927.51 crore in March 2023 before declining to INR 2,608.05 crore in March 2025, with operating profit and net profits also decreasing significantly during this period. Despite these declines, cash flow from operations improved slightly to INR 131 crore in March 2025.

Answer:<BR>The historical performance of Goodyear India shows a fluctuating trend in net sales and profits over the years, with a notable decline in recent periods.<BR><BR>Breakdown:<BR>Goodyear India's net sales increased from INR 2,435.68 crore in March 2022 to INR 2,608.05 crore in March 2025, although it peaked at INR 2,927.51 crore in March 2023 before declining. The total operating income followed a similar pattern, reaching a high of INR 2,927.51 crore in March 2023 and then decreasing to INR 2,608.05 crore in March 2025. The company's operating profit (PBDIT) also saw a decline from INR 239.34 crore in March 2021 to INR 134.11 crore in March 2025, reflecting a decrease in operating profit margin from 12.1% to 4.47% over the same period. Profit before tax decreased from INR 183.17 crore in March 2021 to INR 74.68 crore in March 2025, while profit after tax dropped from INR 136.26 crore to INR 55.12 crore. The company's total assets decreased from INR 1,390.60 crore in March 2021 to INR 1,243.71 crore in March 2025, with total liabilities also declining from INR 1,390.60 crore to INR 1,243.71 crore. Cash flow from operating activities showed a slight increase to INR 131 crore in March 2025, while net cash inflow improved to INR 70 crore, indicating some recovery in cash management despite the overall decline in profitability.

View full answer

Is Goodyear India technically bullish or bearish?

05-Dec-2025

As of December 4, 2025, Goodyear India is in a mildly bearish trend, indicated by bearish MACD signals and Bollinger Bands on both weekly and monthly charts, despite a bullish RSI on the weekly time frame.

As of 4 December 2025, the technical trend for Goodyear India has changed from sideways to mildly bearish. The current stance is mildly bearish, driven by bearish signals from the MACD on both weekly and monthly time frames. The Bollinger Bands also indicate a mildly bearish trend on both weekly and monthly charts. Although the RSI is bullish on the weekly time frame, the overall sentiment is dampened by the Dow Theory and KST, both showing bearish signals on the weekly and monthly time frames. Daily moving averages are mildly bullish, but this is not strong enough to counter the prevailing bearish indicators. Overall, the strength of the bearish stance is moderate, reflecting recent underperformance against the Sensex across multiple time frames.

View full answer

When is the next results date for Goodyear India Ltd?

30-Jan-2026

The next results date for Goodyear India Ltd is 05 February 2026.

The next results date for Goodyear India Ltd is scheduled for 05 February 2026.

View full answer

Are Goodyear India Ltd latest results good or bad?

06-Feb-2026

Goodyear India Ltd's latest Q3 FY26 results are disappointing, with a 16.98% decline in net profit to ₹13.07 crore and a 12.57% drop in net sales to ₹596.46 crore, indicating operational challenges and weaker competitive positioning in the market.

Goodyear India Ltd's latest results for Q3 FY26 indicate a challenging performance. The company reported a net profit of ₹13.07 crore, which reflects a significant decline of 16.98% year-on-year. Additionally, net sales decreased by 12.57% compared to the same quarter last year, totaling ₹596.46 crore. <BR><BR>The operating margin has also come under pressure, dropping to 4.50%, which is a decrease of 206 basis points from the previous year. This decline in both profitability and sales suggests that Goodyear India is facing operational challenges, particularly in a competitive market where demand dynamics appear to be weakening.<BR><BR>Overall, these results can be characterized as negative, highlighting ongoing issues in revenue generation and profitability. The company’s performance has been further compounded by a significant underperformance compared to its peers in the tyre industry, raising concerns about its competitive positioning and future growth prospects.

View full answer

Should I buy, sell or hold Goodyear India Ltd?

06-Feb-2026

Why is Goodyear India Ltd falling/rising?

08-Feb-2026

As of 08-Feb, Goodyear India Ltd's stock price is rising to 843.70, up 6.39%, driven by strong short-term gains and high investor participation. Despite a decline in long-term growth, the stock's recent performance and financial stability have attracted investor interest.

As of 08-Feb, Goodyear India Ltd's stock price is rising, currently at 843.70, reflecting an increase of 50.65 or 6.39%. This upward movement can be attributed to several factors. Firstly, the stock has outperformed its sector by 3.35% today and has experienced consecutive gains over the last two days, accumulating a total return of 7.89% during this period. Additionally, the stock opened with a significant gain of 13.49% today and reached an intraday high of Rs 920, marking a 16.01% increase.<BR><BR>The stock's performance is also supported by a high level of investor participation, with delivery volume rising by 296.92% compared to the 5-day average. Furthermore, the company boasts a high management efficiency with a return on equity (ROE) of 16.15% and a low debt-to-equity ratio, indicating financial stability. The high dividend yield of 3.01% at the current price may also attract investors.<BR><BR>Despite these positive indicators, it is important to note that the stock has shown poor long-term growth, with operating profit declining at an annual rate of -11.86% over the past five years. However, the recent short-term performance and investor interest have contributed to the current rise in stock price.

View full answer
iScoreScore
Click here to find our call on this stock
Strong Sell
Sell
Hold
Buy
Strong Buy

MarketsMojo — Loved in India, Now Global

The power of Mojo is now in 29 countries. Explore global equities with the same cutting-edge features you love.

Dashboard

1

Poor long term growth as Operating profit has grown by an annual rate -7.89% of over the last 5 years

 
2

With ROE of 9.9, it has a Expensive valuation with a 3.4 Price to Book Value

3

Consistent Underperformance against the benchmark over the last 3 years

stock-summaryMojo Parameters

Mojo Parameters

Loading Valuation Snapshot...

Stock DNA

stock-summary
Industry

Tyres & Rubber Products

stock-summary
Market cap

INR 1,993 Cr (Small Cap)

stock-summary
P/E

34.00

stock-summary
Industry P/E

31

stock-summary
Dividend Yield

3.01%

stock-summary
Debt Equity

-0.26

stock-summary
Return on Equity

7.23%

stock-summary
Price to Book

3.18

Revenue and Profits:
Net Sales:
607 Cr
(Quarterly Results - Dec 2025)
Net Profit:
25 Cr
stock-summaryTotal Returns
Total Returns (Price + Dividend) stock-summary
Dividend Yield (3.01%)
TimePeriod
Price Return
Dividend Return
Total Return
3 Months
-14.04%
0%
-14.04%
6 Months
-13.91%
0%
-13.91%
1 Year
-9.53%
2.73%
-6.8%
2 Years
-38.38%
2.98%
-35.4%
3 Years
-20.21%
8.80%
-11.41%
4 Years
-11.86%
18.23%
6.37%
5 Years
-13.04%
25.67%
12.63%

Latest dividend: 23.9 per share ex-dividend date: Jul-18-2025

Risk Adjusted Returns v/s stock-summary
Returns Beta
Icon
Beta has not been calculated since enough price history is not available
stock-summaryNews & Corporate Actions

News

Goodyear India Ltd Gains 7.16%: 4 Key Factors Driving the Week’s Rally

Key Events This Week

2 Feb: New 52-week low (Rs.769.65)

5 Feb: Q3 FY26 results reveal margin pressures

6 Feb: Intraday high surge of 10.59% (Rs.920)

6 Feb: Strong gap up opening reflects positive sentiment

Why is Goodyear India Ltd falling/rising?

Strong Intraday Performance and Sector Momentum

Goodyear India Ltd opened the trading session with a notable gap up of 13.49%, signalling strong buying interest from the outset. The stock reached an intraday high of ₹920, marking a 16.01% surge before settling at ₹843.70. This wide trading range of ₹90 and an intraday volatility of 5.14% reflect heightened market activity and investor enthusiasm. The stock outperformed its sector, Tyres & Allied, which itself gained 3.04% on the day, underscoring a favourable industry environment that buoyed Goodyear’s shares.

Moreover, the stock has been on an upward trajectory for two consecutive days, delivering a 7.89% return in this short span. This recent momentum contrasts with its year-to-date performance, which remains sli...

Read full news article
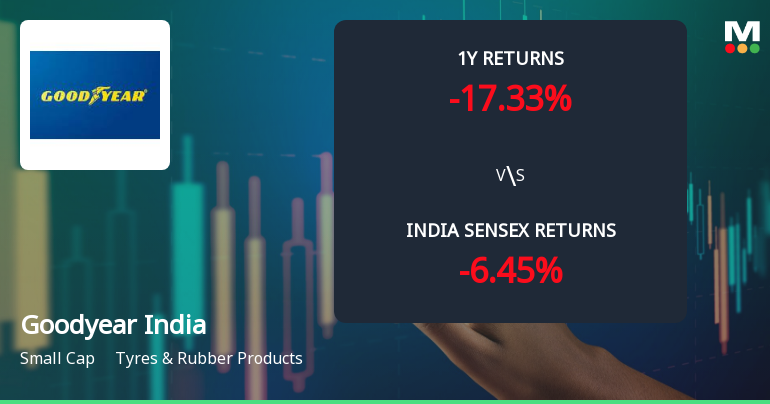
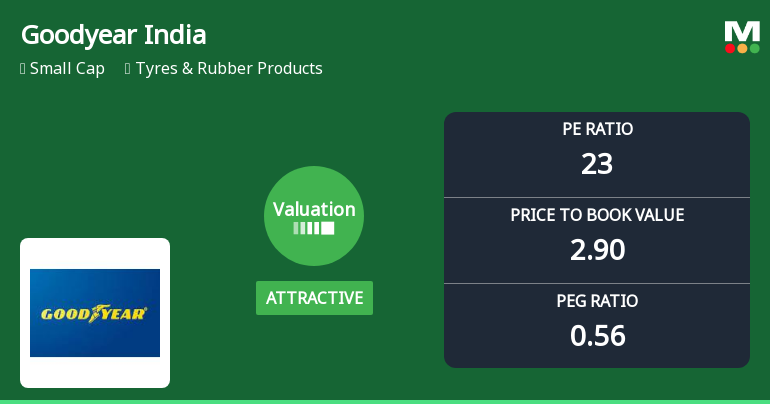
Announcements stock-summary

Announcement under Regulation 30 (LODR)-Newspaper Publication

06-Feb-2026 | Source : BSE

Intimation of publication of Financial Results for the quarter and nine months ended December 31 2025

Unaudited Financial Results For The Quarter And Nine Months Ended December 31 2025

05-Feb-2026 | Source : BSE

Unaudited Financial results for the quarter and nine months ended December 31 2025

Board Meeting Outcome for Outcome Of The Board Meeting Held On February 05 2026

05-Feb-2026 | Source : BSE

Outcome of the Board Meeting held on February 05 2026

Corporate Actions stock-summary

stock-summary
BOARD MEETING

No Upcoming Board Meetings

stock-summary
DIVIDEND

Goodyear India Ltd has declared 239% dividend, ex-date: 18 Jul 25

stock-summary
SPLITS

No Splits history available

stock-summary
BONUS

No Bonus history available

stock-summary
RIGHTS

No Rights history available

stock-summaryKey Factors

Quality key factors stock-summary

Factor
Value
Sales Growth (5y)
9.04%
EBIT Growth (5y)
-11.86%
EBIT to Interest (avg)
27.24
Debt to EBITDA (avg)
0.10
Net Debt to Equity (avg)
-0.26
Sales to Capital Employed (avg)
3.97
Tax Ratio
26.04%
Dividend Payout Ratio
100.03%
Pledged Shares
0
Institutional Holding
8.35%
ROCE (avg)
36.91%
ROE (avg)
16.15%

Valuation key factors

Factor
Value
P/E Ratio
34
Industry P/E
31
Price to Book Value
3.39
EV to EBIT
28.13
EV to EBITDA
15.68
EV to Capital Employed
4.22
EV to Sales
0.73
PEG Ratio
1.49
Dividend Yield
2.83%
ROCE (Latest)
10.34%
ROE (Latest)
9.86%

Technicals key factors

Indicator
Weekly
Monthly
MACD
Bearish
Bearish
RSI
No Signal
No Signal
Bollinger Bands
Mildly Bearish
Mildly Bearish
Moving Averages
Mildly Bearish (Daily)
KST
Bearish
Mildly Bullish
Dow Theory
No Trend
Mildly Bearish
stock-summary Technical Indicator Scale: Bearish, Mildly Bearish, Sideways, Mildly Bullish, Bullish  Turned 
stock-summaryShareholding
Shareholding Snapshot : Dec 2025stock-summary
Shareholding Compare (%holding) stock-summary
Majority shareholders

Promoters

Pledged Promoter Holdings

None

Mutual Funds

Held by 3 Schemes (6.76%)

FIIs

Held by 6 FIIs (0.34%)

Promoter with highest holding

Goodyear Orient Company (private) Limited (74.0%)

Highest Public shareholder

Hdfc Small Cap Fund (6.75%)

Individual Investors Holdings

12.5%

stock-summaryFinancial
[
  {
    "link": "quarterly",
    "btn_text": "All Quarterly Results",
    "header": "Quarterly Results Snapshot (Standalone) - Dec'25 - QoQ",
    "rhs": [
      {
        "prefix": "Net Sales ",
        "suffix": "QoQ Growth in quarter ended Dec 2025 is 1.75% vs -9.11% in Sep 2025",
        "dir": 1
      },
      {
        "prefix": "Standalone Net Profit ",
        "suffix": "QoQ Growth in quarter ended Dec 2025 is 88.45% vs -7.37% in Sep 2025",
        "dir": 1
      }
    ],
    "table": {
      "header": [
        "Dec'25",
        "Sep'25",
        "Change(%)"
      ],
      "body": [
        {
          "field": "Net Sales",
          "val1": "606.91",
          "val2": "596.46",
          "chgp": "1.75%",
          "chgp_class": "positive"
        },
        {
          "field": "Operating Profit (PBDIT) excl Other Income",
          "val1": "42.17",
          "val2": "26.85",
          "chgp": "57.06%",
          "chgp_class": "positive"
        },
        {
          "field": "Interest",
          "val1": "1.20",
          "val2": "1.30",
          "chgp": "-7.69%",
          "chgp_class": "positive"
        },
        {
          "field": "Exceptional Items",
          "val1": "0.00",
          "val2": "0.00",
          "chgp": "",
          "chgp_class": "neutral"
        },
        {
          "field": "Standalone Net Profit",
          "val1": "24.63",
          "val2": "13.07",
          "chgp": "88.45%",
          "chgp_class": "positive"
        },
        {
          "field": "Operating Profit Margin (Excl OI)",
          "val1": "6.95%",
          "val2": "4.50%",
          "chgp": "2.45%",
          "chgp_class": "positive"
        }
      ]
    }
  },
  {
    "link": "half-yearly",
    "btn_text": "All Half Yearly Results",
    "header": "Half Yearly Results Snapshot (Standalone) - Sep'25",
    "rhs": [
      {
        "prefix": "Net Sales ",
        "suffix": " Growth in half year ended Sep 2025 is -8.81% vs -2.56% in Sep 2024",
        "dir": -1
      },
      {
        "prefix": "Standalone Net Profit ",
        "suffix": " Growth in half year ended Sep 2025 is -33.33% vs -47.19% in Sep 2024",
        "dir": 1
      }
    ],
    "table": {
      "header": [
        "Sep'25",
        "Sep'24",
        "Change(%)"
      ],
      "body": [
        {
          "field": "Net Sales",
          "val1": "1,252.68",
          "val2": "1,373.63",
          "chgp": "-8.81%",
          "chgp_class": "negative"
        },
        {
          "field": "Operating Profit (PBDIT) excl Other Income",
          "val1": "55.08",
          "val2": "75.42",
          "chgp": "-26.97%",
          "chgp_class": "negative"
        },
        {
          "field": "Interest",
          "val1": "2.56",
          "val2": "1.86",
          "chgp": "37.63%",
          "chgp_class": "negative"
        },
        {
          "field": "Exceptional Items",
          "val1": "0.00",
          "val2": "0.00",
          "chgp": "",
          "chgp_class": "neutral"
        },
        {
          "field": "Standalone Net Profit",
          "val1": "27.18",
          "val2": "40.77",
          "chgp": "-33.33%",
          "chgp_class": "negative"
        },
        {
          "field": "Operating Profit Margin (Excl OI)",
          "val1": "4.40%",
          "val2": "5.49%",
          "chgp": "-1.09%",
          "chgp_class": "negative"
        }
      ]
    }
  },
  {
    "link": "nine-monthly",
    "btn_text": "All Nine Monthly Results",
    "header": "Nine Monthly Results Snapshot (Standalone) - Dec'25",
    "rhs": [
      {
        "prefix": "Net Sales ",
        "suffix": "YoY Growth in nine months ended Dec 2025 is -7.27% vs 0.21% in Dec 2024",
        "dir": -1
      },
      {
        "prefix": "Standalone Net Profit ",
        "suffix": "YoY Growth in nine months ended Dec 2025 is 3.10% vs -49.27% in Dec 2024",
        "dir": 1
      }
    ],
    "table": {
      "header": [
        "Dec'25",
        "Dec'24",
        "Change(%)"
      ],
      "body": [
        {
          "field": "Net Sales",
          "val1": "1,859.59",
          "val2": "2,005.35",
          "chgp": "-7.27%",
          "chgp_class": "negative"
        },
        {
          "field": "Operating Profit (PBDIT) excl Other Income",
          "val1": "97.25",
          "val2": "99.25",
          "chgp": "-2.02%",
          "chgp_class": "negative"
        },
        {
          "field": "Interest",
          "val1": "3.76",
          "val2": "3.36",
          "chgp": "11.90%",
          "chgp_class": "negative"
        },
        {
          "field": "Exceptional Items",
          "val1": "0.00",
          "val2": "0.00",
          "chgp": "",
          "chgp_class": "neutral"
        },
        {
          "field": "Standalone Net Profit",
          "val1": "51.81",
          "val2": "50.25",
          "chgp": "3.10%",
          "chgp_class": "positive"
        },
        {
          "field": "Operating Profit Margin (Excl OI)",
          "val1": "5.23%",
          "val2": "4.95%",
          "chgp": "0.28%",
          "chgp_class": "positive"
        }
      ]
    }
  },
  {
    "link": "annual",
    "btn_text": "All Annual Results",
    "header": "Annual Results Snapshot (Standalone) - Mar'25",
    "rhs": [
      {
        "prefix": "Net Sales ",
        "suffix": "YoY Growth in year ended Mar 2025 is 2.21% vs -12.84% in Mar 2024",
        "dir": 1
      },
      {
        "prefix": "Standalone Net Profit ",
        "suffix": "YoY Growth in year ended Mar 2025 is -41.89% vs -22.80% in Mar 2024",
        "dir": -1
      }
    ],
    "table": {
      "header": [
        "Mar'25",
        "Mar'24",
        "Change(%)"
      ],
      "body": [
        {
          "field": "Net Sales",
          "val1": "2,608.05",
          "val2": "2,551.71",
          "chgp": "2.21%",
          "chgp_class": "positive"
        },
        {
          "field": "Operating Profit (PBDIT) excl Other Income",
          "val1": "116.59",
          "val2": "170.59",
          "chgp": "-31.65%",
          "chgp_class": "negative"
        },
        {
          "field": "Interest",
          "val1": "4.68",
          "val2": "4.24",
          "chgp": "10.38%",
          "chgp_class": "negative"
        },
        {
          "field": "Exceptional Items",
          "val1": "0.00",
          "val2": "0.00",
          "chgp": "",
          "chgp_class": "neutral"
        },
        {
          "field": "Standalone Net Profit",
          "val1": "55.12",
          "val2": "94.85",
          "chgp": "-41.89%",
          "chgp_class": "negative"
        },
        {
          "field": "Operating Profit Margin (Excl OI)",
          "val1": "4.47%",
          "val2": "6.69%",
          "chgp": "-2.22%",
          "chgp_class": "negative"
        }
      ]
    }
  }
]

Quarterly Results Snapshot (Standalone) - Dec'25 - QoQstock-summary

Dec'25
Sep'25
Change(%)
Net Sales
606.91
596.46
1.75%
Operating Profit (PBDIT) excl Other Income
42.17
26.85
57.06%
Interest
1.20
1.30
-7.69%
Exceptional Items
0.00
0.00
Standalone Net Profit
24.63
13.07
88.45%
Operating Profit Margin (Excl OI)
6.95%
4.50%
2.45%
Values in Rs Cr.
Direction Arrows
Net Sales

QoQ Growth in quarter ended Dec 2025 is 1.75% vs -9.11% in Sep 2025

Direction Arrows
Standalone Net Profit

QoQ Growth in quarter ended Dec 2025 is 88.45% vs -7.37% in Sep 2025

Half Yearly Results Snapshot (Standalone) - Sep'25stock-summary

Sep'25
Sep'24
Change(%)
Net Sales
1,252.68
1,373.63
-8.81%
Operating Profit (PBDIT) excl Other Income
55.08
75.42
-26.97%
Interest
2.56
1.86
37.63%
Exceptional Items
0.00
0.00
Standalone Net Profit
27.18
40.77
-33.33%
Operating Profit Margin (Excl OI)
4.40%
5.49%
-1.09%
Values in Rs Cr.
Direction Arrows
Net Sales

Growth in half year ended Sep 2025 is -8.81% vs -2.56% in Sep 2024

Direction Arrows
Standalone Net Profit

Growth in half year ended Sep 2025 is -33.33% vs -47.19% in Sep 2024

Nine Monthly Results Snapshot (Standalone) - Dec'25stock-summary

Dec'25
Dec'24
Change(%)
Net Sales
1,859.59
2,005.35
-7.27%
Operating Profit (PBDIT) excl Other Income
97.25
99.25
-2.02%
Interest
3.76
3.36
11.90%
Exceptional Items
0.00
0.00
Standalone Net Profit
51.81
50.25
3.10%
Operating Profit Margin (Excl OI)
5.23%
4.95%
0.28%
Values in Rs Cr.
Direction Arrows
Net Sales

YoY Growth in nine months ended Dec 2025 is -7.27% vs 0.21% in Dec 2024

Direction Arrows
Standalone Net Profit

YoY Growth in nine months ended Dec 2025 is 3.10% vs -49.27% in Dec 2024

Annual Results Snapshot (Standalone) - Mar'25stock-summary

Mar'25
Mar'24
Change(%)
Net Sales
2,608.05
2,551.71
2.21%
Operating Profit (PBDIT) excl Other Income
116.59
170.59
-31.65%
Interest
4.68
4.24
10.38%
Exceptional Items
0.00
0.00
Standalone Net Profit
55.12
94.85
-41.89%
Operating Profit Margin (Excl OI)
4.47%
6.69%
-2.22%
Values in Rs Cr.
Direction Arrows
Net Sales

YoY Growth in year ended Mar 2025 is 2.21% vs -12.84% in Mar 2024

Direction Arrows
Standalone Net Profit

YoY Growth in year ended Mar 2025 is -41.89% vs -22.80% in Mar 2024

stock-summaryCompany CV
About Goodyear India Ltd stock-summary
stock-summary
Goodyear India Ltd
Small Cap
Tyres & Rubber Products
Goodyear India Limited, earlier incorporated as 'Goodyear Tire and Rubber Company (India) Limited', acquired its present name in 1961 when it became a public limited company. A FERA company, with Goodyear Tire and Rubber, US, as the holding company with a stake of 74%, manufactures tyres and rubber goods used by the automobile industry, at its plant in Ballabgarh, Uttar Pradesh.
Company Coordinates stock-summary
Company Details
Mathura Road, Ballabgarh Faridabad Haryana : 121004
stock-summary
Tel: 91-129-6611000
stock-summary
goodyearindia_investorcell@goodyear
Registrar Details
Skyline Financial Services Pvt Ltd , D-153/A, 1st Floor, Okhla Industrial Area, Phase - I, New Delhi