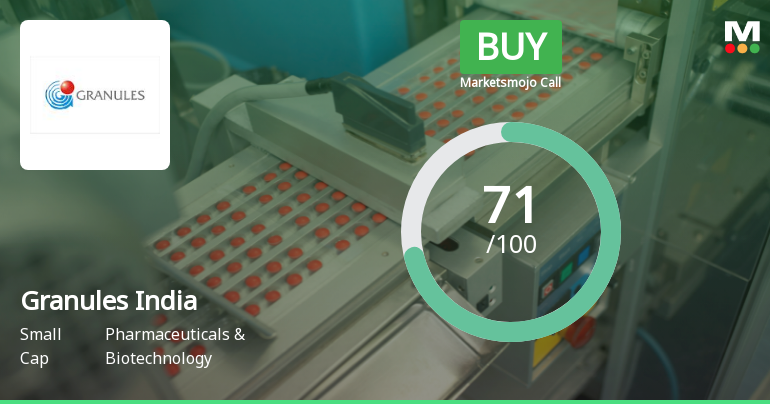
Granules India

  • Market Cap: Small Cap
  • Industry: Pharmaceuticals & Biotechnology
  • ISIN: INE101D01020
  • NSEID: GRANULES
  • BSEID: 532482
INR
872.45
34.25 (4.09%)
BSENSE

Aug 07, 03:30 PM

BSE+NSE Vol: 11.72 lacs

  • Price Points
  • Score
  • Mojo Parameters
  • Total Return
  • News and Corporate Actions
  • Key factors
  • Shareholding
  • Financials
  • CompanyCV
stock-summaryPrice Point
High/Low

1Day

52 Week

Valuation
Technical
Day's Volume

CASH

11.72 lacs (45.72%) Volume

Shareholding (Jun 2026)

FII

17.50%

Held by 219 FIIs

DII

16.11%

Held by 24 DIIs

Promoter

38.02%

Why is Granules India Ltd falling/rising?

09-Aug-2026

As of 08-Aug, Granules India Ltd's stock price is rising to 872.45, up 4.09%, driven by strong financial health, impressive returns, and positive market sentiment. The company has shown significant outperformance compared to the Sensex and maintains a bullish trend with high institutional holdings.

As of 08-Aug, Granules India Ltd's stock price is rising, currently at 872.45, reflecting an increase of 34.25 or 4.09%. This upward movement can be attributed to several positive factors. The stock has shown strong performance relative to the benchmark Sensex, with a 1-week return of +5.87% compared to the Sensex's +0.52%. Over the past year, Granules India Ltd has generated an impressive return of 94.07%, significantly outperforming the Sensex, which has declined by 2.63% during the same period.<BR><BR>Additionally, the company has demonstrated solid financial health, with a high return on capital employed (ROCE) of 16.82% and a low debt to EBITDA ratio of 1.28 times, indicating a strong ability to service its debt. The company has also reported positive results for the last three consecutive quarters, with a profit after tax (PAT) growth of 41.39% and record net sales of Rs 1,476.77 crore.<BR><BR>Moreover, Granules India Ltd is trading above its moving averages across various time frames, which typically signals a bullish trend. The stock is also close to its 52-week high, just 4.6% away from Rs 910, and has outperformed its sector by 3.67% today. High institutional holdings at 33.61% further support the stock's rise, as these investors tend to have better resources for analyzing company fundamentals.<BR><BR>Despite some concerns regarding long-term growth and valuation, the current performance metrics and positive market sentiment contribute to the stock's rising price.

View full answer

Which are the latest news on Granules India?

09-Aug-2026

Are Granules India Ltd latest results good or bad?

22-Jul-2026

Granules India Ltd's latest results show strong year-on-year revenue growth of 22.04% and record quarterly sales, but a 10.72% decline in net profit and reduced margins raise concerns about profitability sustainability. Overall, the results are mixed, highlighting both growth potential and challenges.

Granules India Ltd's latest results present a mixed picture. In Q1 FY27, the company reported a net profit of ₹179.96 crores, which is a decline of 10.72% compared to the previous quarter. However, this figure shows a significant year-on-year increase of 59.77%, indicating strong growth over the past year.<BR><BR>On the revenue front, net sales reached ₹1,476.77 crores, reflecting a modest quarter-on-quarter growth of 0.42% and a more impressive year-on-year growth of 22.04%. This marks the highest quarterly revenue in the company's history and the seventh consecutive quarter of revenue growth.<BR><BR>Despite the positive sales growth, profitability metrics have faced some challenges. The operating margin decreased to 23.13%, down from 24.16% in the previous quarter, while the PAT margin also contracted to 12.28%. These declines are attributed to increased employee costs and a normalization following an exceptionally strong performance in the previous quarter.<BR><BR>Overall, while the revenue growth is commendable and indicates a solid operational performance, the decline in net profit and margins raises some concerns about the sustainability of profitability in the near term. Investors may want to keep an eye on these trends as the company navigates its growth strategy amid these challenges.

View full answer

Should I buy, sell or hold Granules India Ltd?

22-Jul-2026

How big is Granules India?

11-Jun-2026

As of 10th June, Granules India Ltd has a market capitalization of 19,145.00 Cr, with recent net sales of 5,365.63 Cr and a net profit of 595.03 Cr.

As of 10th June, Granules India Ltd has a market capitalization of 19,145.00 Cr, categorizing it as a Small Cap company.<BR><BR>In the latest four quarters, Granules India reported Net Sales of 5,365.63 Cr and a Net Profit of 595.03 Cr.<BR><BR>The latest annual period for the balance sheet is March 2025, with Shareholder's Funds amounting to 3,715.58 Cr and Total Assets of 6,184.73 Cr.

View full answer

Who are in the management team of Granules India?

11-Jun-2026

The management team of Granules India includes C Krishna Prasad (Chairman & Managing Director), KVS Ram Rao (Joint Managing Director & CEO), and several other directors, bringing diverse expertise to the company. Key members also include Harsha Chigurupati, Uma Devi Chigurupati, and various independent and non-executive directors.

The management team of Granules India includes the following key individuals:<BR><BR>1. **C Krishna Prasad** - Chairman & Managing Director<BR>2. **KVS Ram Rao** - Joint Managing Director & CEO<BR>3. **Harsha Chigurupati** - Executive Director<BR>4. **Uma Devi Chigurupati** - Executive Director<BR>5. **A Arun Rao Akinepally** - Non-Executive & Independent Director<BR>6. **Arun Sawhney** - Non-Executive & Independent Director<BR>7. **Saumen Chakraborty** - Independent Director<BR>8. **Sucharita Rao Palepu** - Independent Director<BR>9. **K B Sankara Rao** - Non-Executive & Non-Independent Director<BR>10. **Chaitanya Tummala** - Company Secretary & Compliance Officer<BR>11. **Kapil Mehan** - Independent Director<BR><BR>This team brings a diverse range of expertise and leadership to the company.

View full answer

Who are the peers of the Granules India?

11-Jun-2026

Granules India's peers include Astrazeneca Pharma, Pfizer, OneSource Speciality, ERIS Lifescience, Caplin Point Lab, Cohance Life, Natco Pharma, Jubilant Pharma, and Alembic Pharma. Granules India has the highest 1-year return at 45.79%, while Cohance Life has the lowest at -57.72%, with most peers showing below-average growth and varying management risks.

Peers: The peers of Granules India are Astrazeneca Phar, Pfizer, OneSource Speci., ERIS Lifescience, Caplin Point Lab, Cohance Life, Natco Pharma, Jubilant Pharmo, and Alembic Pharma.<BR><BR>Quality Snapshot: Excellent management risk is observed at Astrazeneca Phar and Caplin Point Lab, while Good management risk is found at Pfizer, Granules India, ERIS Lifescience, and Natco Pharma. Below Average management risk is noted at OneSource Speci., and Average management risk is found at Cohance Life and Jubilant Pharmo. All peers exhibit Below Average growth except for OneSource Speci., which has Excellent growth. The Capital Structure is Excellent for Astrazeneca Phar, Pfizer, Granules India, Caplin Point Lab, and Natco Pharma, while Good is noted for ERIS Lifescience, and Average for Jubilant Pharmo.<BR><BR>Return Snapshot: Granules India has the highest 1-year return at 45.79%, while Cohance Life has the lowest at -57.72%. Compared to Granules India, all peers have lower 1-year returns. Additionally, Cohance Life, ERIS Lifescience, Natco Pharma, Jubilant Pharmo, and Alembic Pharma have negative six-month returns.

View full answer

What does Granules India do?

10-Jun-2026

Granules India Limited is a vertically integrated pharmaceutical company that manufactures Active Pharmaceutical Ingredients, Pharmaceutical Formulation Intermediates, and Finished Dosage forms. As of March 2026, it reported net sales of ₹1,471 Cr and a net profit of ₹202 Cr, with a market cap of ₹19,145 Cr.

Overview:<BR>Granules India Limited is a large-scale vertically integrated company in the Pharmaceuticals & Biotechnology industry, specializing in the manufacturing of Active Pharmaceutical Ingredients (API), Pharmaceutical Formulation Intermediates (PFI), and Finished Dosage (FD).<BR><BR>History:<BR>Granules India Ltd was founded on March 18th, 1991. The company has maintained its status as a leader in the off-patent drugs segment and has reported net sales and profit for the latest quarter ending March 2026.<BR><BR>Financial Snapshot:<BR>Net Sales: 1,471 Cr (Quarterly Results - Mar 2026) <BR>Net Profit: 202 Cr (Quarterly Results - Mar 2026) <BR>Market Cap: INR 19,145 Cr (Small Cap)<BR><BR>Key Metrics:<BR>P/E: 31.00 <BR>Industry P/E: 34 <BR>Dividend Yield: 0.19% <BR>Debt-Equity: 0.11 <BR>Return on Equity: 11.86% <BR>Price to Book: 3.74 <BR><BR>Contact Details:<BR>Address: Second Floor Block III, My Home Hub Madhapur Hyderabad Telangana : 500081 <BR>Tel: 91-40-66760000 <BR>Email: investorrelations@granulesindia.com <BR>Website: http://www.granulesindia.com

View full answer

When is the next results date for Granules India Ltd?

17-Apr-2026

The next results date for Granules India Ltd is April 29, 2026.

The next results date for Granules India Ltd is scheduled for April 29, 2026.

View full answer

Is Granules India technically bullish or bearish?

02-Dec-2025

As of December 1, 2025, Granules India has shifted to a bullish trend with moderate strength, supported by bullish indicators like the MACD and Bollinger Bands, although caution is advised due to mildly bearish monthly MACD and KST signals.

As of 1 December 2025, the technical trend for Granules India has changed from mildly bullish to bullish. The current stance is bullish with moderate strength. Key indicators driving this include a bullish MACD on the weekly chart, bullish Bollinger Bands on both weekly and monthly time frames, and a bullish daily moving average. However, the monthly MACD and KST remain mildly bearish, indicating some caution. The stock has shown a strong performance over the past three years compared to the Sensex, further supporting the bullish outlook.

View full answer

How has been the historical performance of Granules India?

01-Dec-2025

Granules India has experienced fluctuating net sales and profits, peaking at 4,511.92 Cr in March 2023 before a slight decline by March 2025, while operating profit increased to 958.16 Cr due to reduced raw material costs. The company showed resilience with growth in total assets and improved cash flow from operating activities, despite variations in profit before and after tax.

Answer:<BR>The historical performance of Granules India shows a fluctuating trend in net sales and profits over the years, with a notable increase in recent periods.<BR><BR>Breakdown:<BR>Granules India's net sales peaked at 4,511.92 Cr in March 2023 but slightly declined to 4,481.61 Cr by March 2025. The total operating income followed a similar pattern, reaching 4,511.92 Cr in March 2023 and then decreasing to 4,481.61 Cr in March 2025. The raw material costs decreased significantly from 2,352.65 Cr in March 2023 to 1,724.94 Cr in March 2025, contributing to an operating profit (PBDIT) of 958.16 Cr in March 2025, up from 927.60 Cr in March 2023. However, profit before tax showed fluctuations, with a high of 687.17 Cr in March 2023, dropping to 660.17 Cr in March 2025. The profit after tax also varied, recording 516.60 Cr in March 2023 and 501.52 Cr in March 2025. The company's total assets increased from 4,903.14 Cr in March 2023 to 6,184.73 Cr in March 2025, while total liabilities rose from 4,903.14 Cr to 6,184.73 Cr in the same period. Cash flow from operating activities improved to 866 Cr in March 2025, compared to 738 Cr in March 2023, indicating a positive trend in cash generation. Overall, Granules India has shown resilience in its financial performance, with significant growth in assets and operating profits despite some fluctuations in sales and profits.

View full answer

Is Granules India overvalued or undervalued?

07-Nov-2025

As of November 6, 2025, Granules India is fairly valued with a PE ratio of 28.14, an EV to EBITDA of 15.28, and a ROCE of 15.74%, making it more attractive compared to peers like Sun Pharma and Divi's Lab, despite a recent stock return of -4.20% against the Sensex, while showing a significant long-term gain of 290.73% over the past decade.

As of 6 November 2025, Granules India has moved from an expensive to a fair valuation grade. The company is currently fairly valued based on its valuation metrics. Key ratios include a PE ratio of 28.14, an EV to EBITDA of 15.28, and a ROCE of 15.74%. <BR><BR>In comparison to its peers, Granules India’s PE ratio is lower than Sun Pharma's 35.02 and Divi's Lab's 79.09, indicating a more attractive valuation relative to these companies. Additionally, while Granules India has a PEG ratio of 0.00, indicating potential for growth, it is worth noting that its dividend yield stands at a modest 0.27%. Despite recent underperformance against the Sensex over the past year, with a stock return of -4.20% compared to the Sensex's 3.65%, the long-term performance over the last decade shows a substantial gain of 290.73%.

View full answer

Who are the top shareholders of the Granules India?

17-Jul-2025

The top shareholders of Granules India include promoter Krishna Prasad Chigurupati with 31.65%, mutual funds at 12.24%, foreign institutional investors at 13.24%, and Life Insurance Corporation of India as the largest public shareholder with 5.33%. Individual investors collectively own 16.54% of the shares.

The top shareholders of Granules India include the promoters, who hold the majority of the shares. The promoter with the highest holding is Krishna Prasad Chigurupati, owning 31.65% of the company. Additionally, mutual funds hold 12.24% through 28 schemes, while foreign institutional investors (FIIs) have a stake of 13.24% across 150 entities. The highest public shareholder is Life Insurance Corporation of India, which holds 5.33%. Individual investors collectively own 16.54% of the shares.

View full answer

Has Granules India declared dividend?

06-Jun-2025

Granules India Ltd has declared a 150% dividend, amounting to ₹1.5 per share, with an ex-date of July 30, 2024. The company has shown strong long-term performance, with total returns of 190.17% over the past five years.

Granules India Ltd has declared a 150% dividend.<BR><BR>Dividend Details:<BR>- Percentage announced: 150%<BR>- Amount per share: 1.5<BR>- Ex-date: Jul-30-2024<BR><BR>Dividend Yield: 0.28%.<BR><BR>Total Returns by Period:<BR>In the last 6 months, the price return was -8.15%, with a dividend return of 0%, resulting in a total return of -8.15%.<BR><BR>Over the past year, the price return was 13.06%, with a dividend return of 0.32%, leading to a total return of 13.38%.<BR><BR>In the 2-year period, the price return was 87.46%, and the dividend return was 1.02%, giving a total return of 88.48%.<BR><BR>For the 3-year period, the price return was 94.13%, with a dividend return of 1.57%, resulting in a total return of 95.7%.<BR><BR>In the last 4 years, the price return was 61.48%, and the dividend return was 1.66%, culminating in a total return of 63.14%.<BR><BR>Over the past 5 years, the price return was 187.16%, with a dividend return of 3.01%, leading to a total return of 190.17%.<BR><BR>Overall, Granules India has declared a significant dividend, and the total returns over various periods show a strong performance, particularly over the long term, indicating a positive outlook for investors.

View full answer
iScoreScore
Click here to find our call on this stock
Strong Sell
Sell
Hold
Buy
Strong Buy

Dashboard

1

High Management Efficiency with a high ROCE of 16.82%

 
2

Strong ability to service debt as the company has a low Debt to EBITDA ratio of 1.28 times

 
3

The company has declared Positive results for the last 3 consecutive quarters

4

High Institutional Holdings at 33.61%

5

Market Beating performance in long term as well as near term

stock-summaryMojo Parameters

Mojo Parameters

Loading Valuation Snapshot...

Stock DNA

stock-summary
Industry

Pharmaceuticals & Biotechnology

stock-summary
Market cap

INR 20,970 Cr (Small Cap)

stock-summary
P/E

33.00

stock-summary
Industry P/E

37

stock-summary
Dividend Yield

0.21%

stock-summary
Debt Equity

0.11

stock-summary
Return on Equity

11.86%

stock-summary
Price to Book

4.10

Revenue and Profits:
Net Sales:
1,477 Cr
(Quarterly Results - Jun 2026)
Net Profit:
180 Cr
stock-summaryTotal Returns
Total Returns (Price + Dividend) stock-summary
Dividend Yield (0.21%)
TimePeriod
Price Return
Dividend Return
Total Return
3 Months
17.37%
0.23%
17.6%
6 Months
54.61%
0.30%
54.91%
1 Year
94.07%
0.38%
94.45%
2 Years
32.77%
0.49%
33.26%
3 Years
172.26%
1.61%
173.87%
4 Years
180.58%
2.04%
182.62%
5 Years
130.47%
2.25%
132.72%

Latest dividend: 1.75 per share ex-dividend date: Jul-30-2026

Risk Adjusted Returns v/s stock-summary
Returns Beta
Icon
Beta has not been calculated since enough price history is not available
stock-summaryNews & Corporate Actions

News

Granules India Falls 5.28%: 2 Key Factors Driving the Weekly Decline

Announcements stock-summary

Shareholder Meeting / Postal Ballot-Scrutinizers Report

06-Aug-2026 | Source : BSE

Scrutinizers report for the 35th AGM

Shareholder Meeting / Postal Ballot-Outcome of AGM

06-Aug-2026 | Source : BSE

Outcome of 35th Annual General Meeting of the Company

Disclosures under Reg. 29(2) of SEBI (SAST) Regulations 2011

04-Aug-2026 | Source : BSE

The Exchange has received the disclosure under Regulation 29(2) of SEBI (Substantial Acquisition of Shares & Takeovers) Regulations 2011 for Life Insurance Corporation of India

Corporate Actions stock-summary

stock-summary
BOARD MEETING

No Upcoming Board Meetings

stock-summary
DIVIDEND

Granules India Ltd has declared 175% dividend, ex-date: 30 Jul 26

stock-summary
SPLITS

Granules India Ltd has announced 1:10 stock split, ex-date: 23 Mar 15

stock-summary
BONUS

No Bonus history available

stock-summary
RIGHTS

No Rights history available

stock-summaryKey Factors

Quality key factors stock-summary

Factor
Value
Sales Growth (5y)
10.94%
EBIT Growth (5y)
6.31%
EBIT to Interest (avg)
11.18
Debt to EBITDA (avg)
1.43
Net Debt to Equity (avg)
0.11
Sales to Capital Employed (avg)
0.98
Tax Ratio
24.81%
Dividend Payout Ratio
7.29%
Pledged Shares
0
Institutional Holding
33.61%
ROCE (avg)
17.26%
ROE (avg)
14.29%

Valuation key factors

Factor
Value
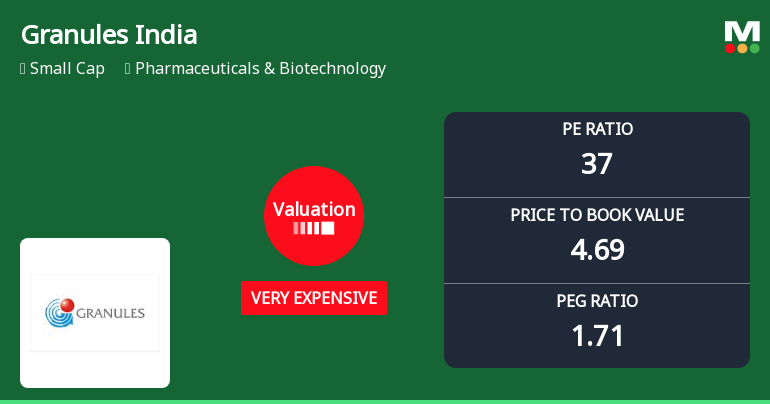
P/E Ratio
33
Industry P/E
37
Price to Book Value
4.24
EV to EBIT
22.80
EV to EBITDA
17.32
EV to Capital Employed
3.92
EV to Sales
3.93
PEG Ratio
0.98
Dividend Yield
0.20%
ROCE (Latest)
15.74%
ROE (Latest)
11.86%

Technicals key factors

Indicator
Weekly
Monthly
MACD
Bullish
Bullish
RSI
No Signal
No Signal
Bollinger Bands
Bullish
Bullish
Moving Averages
Bullish (Daily)
KST
Bullish
Bullish
Dow Theory
Mildly Bearish
No Trend
OBV
No Trend
No Trend
stock-summary Technical Indicator Scale: Bearish, Mildly Bearish, Sideways, Mildly Bullish, Bullish  Turned 
stock-summaryShareholding
Shareholding Snapshot : Jun 2026stock-summary
Shareholding Compare (%holding) stock-summary
Majority shareholders

Promoters

Pledged Promoter Holdings

None

Mutual Funds

Held by 28 Schemes (3.45%)

FIIs

Held by 219 FIIs (17.5%)

Promoter with highest holding

Krishna Prasad Chigurupati (31.0%)

Highest Public shareholder

Life Insurance Corporation Of India (4.1%)

Individual Investors Holdings

17.84%

stock-summaryFinancial
[
  {
    "link": "quarterly",
    "btn_text": "All Quarterly Results",
    "header": "Quarterly Results Snapshot (Consolidated) - Jun'26 - QoQ",
    "rhs": [
      {
        "prefix": "Net Sales ",
        "suffix": "QoQ Growth in quarter ended Jun 2026 is 0.42% vs 5.96% in Mar 2026",
        "dir": -1
      },
      {
        "prefix": "Consolidated Net Profit ",
        "suffix": "QoQ Growth in quarter ended Jun 2026 is -10.72% vs 34.19% in Mar 2026",
        "dir": -1
      }
    ],
    "table": {
      "header": [
        "Jun'26",
        "Mar'26",
        "Change(%)"
      ],
      "body": [
        {
          "field": "Net Sales",
          "val1": "1,476.77",
          "val2": "1,470.61",
          "chgp": "0.42%",
          "chgp_class": "positive"
        },
        {
          "field": "Operating Profit (PBDIT) excl Other Income",
          "val1": "338.90",
          "val2": "352.11",
          "chgp": "-3.75%",
          "chgp_class": "negative"
        },
        {
          "field": "Interest",
          "val1": "21.12",
          "val2": "32.69",
          "chgp": "-35.39%",
          "chgp_class": "positive"
        },
        {
          "field": "Exceptional Items",
          "val1": "0.00",
          "val2": "15.92",
          "chgp": "-100.00%",
          "chgp_class": "negative"
        },
        {
          "field": "Consolidate Net Profit",
          "val1": "179.96",
          "val2": "201.57",
          "chgp": "-10.72%",
          "chgp_class": "negative"
        },
        {
          "field": "Operating Profit Margin (Excl OI)",
          "val1": "23.13%",
          "val2": "24.16%",
          "chgp": "-1.03%",
          "chgp_class": "negative"
        }
      ]
    }
  },
  {
    "link": "half-yearly",
    "btn_text": "All Half Yearly Results",
    "header": "Half Yearly Results Snapshot (Consolidated) - Sep'25",
    "rhs": [
      {
        "prefix": "Net Sales ",
        "suffix": " Growth in half year ended Sep 2025 is 16.80% vs -1.31% in Sep 2024",
        "dir": 1
      },
      {
        "prefix": "Consolidated Net Profit ",
        "suffix": " Growth in half year ended Sep 2025 is 4.90% vs 54.58% in Sep 2024",
        "dir": -1
      }
    ],
    "table": {
      "header": [
        "Sep'25",
        "Sep'24",
        "Change(%)"
      ],
      "body": [
        {
          "field": "Net Sales",
          "val1": "2,507.10",
          "val2": "2,146.48",
          "chgp": "16.80%",
          "chgp_class": "positive"
        },
        {
          "field": "Operating Profit (PBDIT) excl Other Income",
          "val1": "524.95",
          "val2": "462.58",
          "chgp": "13.48%",
          "chgp_class": "positive"
        },
        {
          "field": "Interest",
          "val1": "52.97",
          "val2": "52.69",
          "chgp": "0.53%",
          "chgp_class": "negative"
        },
        {
          "field": "Exceptional Items",
          "val1": "-25.91",
          "val2": "0.00",
          "chgp": "",
          "chgp_class": "neutral"
        },
        {
          "field": "Consolidate Net Profit",
          "val1": "243.24",
          "val2": "231.88",
          "chgp": "4.90%",
          "chgp_class": "positive"
        },
        {
          "field": "Operating Profit Margin (Excl OI)",
          "val1": "20.97%",
          "val2": "21.76%",
          "chgp": "-0.79%",
          "chgp_class": "negative"
        }
      ]
    }
  },
  {
    "link": "nine-monthly",
    "btn_text": "All Nine Monthly Results",
    "header": "Nine Monthly Results Snapshot (Consolidated) - Dec'25",
    "rhs": [
      {
        "prefix": "Net Sales ",
        "suffix": "YoY Growth in nine months ended Dec 2025 is 18.60% vs -1.39% in Dec 2024",
        "dir": 1
      },
      {
        "prefix": "Consolidated Net Profit ",
        "suffix": "YoY Growth in nine months ended Dec 2025 is 12.58% vs 26.78% in Dec 2024",
        "dir": -1
      }
    ],
    "table": {
      "header": [
        "Dec'25",
        "Dec'24",
        "Change(%)"
      ],
      "body": [
        {
          "field": "Net Sales",
          "val1": "3,895.04",
          "val2": "3,284.18",
          "chgp": "18.60%",
          "chgp_class": "positive"
        },
        {
          "field": "Operating Profit (PBDIT) excl Other Income",
          "val1": "833.05",
          "val2": "692.88",
          "chgp": "20.23%",
          "chgp_class": "positive"
        },
        {
          "field": "Interest",
          "val1": "81.66",
          "val2": "79.26",
          "chgp": "3.03%",
          "chgp_class": "negative"
        },
        {
          "field": "Exceptional Items",
          "val1": "-25.91",
          "val2": "0.00",
          "chgp": "",
          "chgp_class": "neutral"
        },
        {
          "field": "Consolidate Net Profit",
          "val1": "393.45",
          "val2": "349.48",
          "chgp": "12.58%",
          "chgp_class": "positive"
        },
        {
          "field": "Operating Profit Margin (Excl OI)",
          "val1": "21.39%",
          "val2": "21.10%",
          "chgp": "0.29%",
          "chgp_class": "positive"
        }
      ]
    }
  },
  {
    "link": "annual",
    "btn_text": "All Annual Results",
    "header": "Annual Results Snapshot (Consolidated) - Mar'26",
    "rhs": [
      {
        "prefix": "Net Sales ",
        "suffix": "YoY Growth in year ended Mar 2026 is 19.73% vs -0.55% in Mar 2025",
        "dir": 1
      },
      {
        "prefix": "Consolidated Net Profit ",
        "suffix": "YoY Growth in year ended Mar 2026 is 18.64% vs 23.74% in Mar 2025",
        "dir": -1
      }
    ],
    "table": {
      "header": [
        "Mar'26",
        "Mar'25",
        "Change(%)"
      ],
      "body": [
        {
          "field": "Net Sales",
          "val1": "5,365.65",
          "val2": "4,481.61",
          "chgp": "19.73%",
          "chgp_class": "positive"
        },
        {
          "field": "Operating Profit (PBDIT) excl Other Income",
          "val1": "1,185.15",
          "val2": "945.24",
          "chgp": "25.38%",
          "chgp_class": "positive"
        },
        {
          "field": "Interest",
          "val1": "114.35",
          "val2": "103.24",
          "chgp": "10.76%",
          "chgp_class": "negative"
        },
        {
          "field": "Exceptional Items",
          "val1": "-10.00",
          "val2": "30.75",
          "chgp": "-132.52%",
          "chgp_class": "negative"
        },
        {
          "field": "Consolidate Net Profit",
          "val1": "595.02",
          "val2": "501.52",
          "chgp": "18.64%",
          "chgp_class": "positive"
        },
        {
          "field": "Operating Profit Margin (Excl OI)",
          "val1": "22.20%",
          "val2": "21.21%",
          "chgp": "0.99%",
          "chgp_class": "positive"
        }
      ]
    }
  }
]

Quarterly Results Snapshot (Consolidated) - Jun'26 - QoQstock-summary

Jun'26
Mar'26
Change(%)
Net Sales
1,476.77
1,470.61
0.42%
Operating Profit (PBDIT) excl Other Income
338.90
352.11
-3.75%
Interest
21.12
32.69
-35.39%
Exceptional Items
0.00
15.92
-100.00%
Consolidate Net Profit
179.96
201.57
-10.72%
Operating Profit Margin (Excl OI)
23.13%
24.16%
-1.03%
Values in Rs Cr.
Direction Arrows
Net Sales

QoQ Growth in quarter ended Jun 2026 is 0.42% vs 5.96% in Mar 2026

Direction Arrows
Consolidated Net Profit

QoQ Growth in quarter ended Jun 2026 is -10.72% vs 34.19% in Mar 2026

Half Yearly Results Snapshot (Consolidated) - Sep'25stock-summary

Sep'25
Sep'24
Change(%)
Net Sales
2,507.10
2,146.48
16.80%
Operating Profit (PBDIT) excl Other Income
524.95
462.58
13.48%
Interest
52.97
52.69
0.53%
Exceptional Items
-25.91
0.00
Consolidate Net Profit
243.24
231.88
4.90%
Operating Profit Margin (Excl OI)
20.97%
21.76%
-0.79%
Values in Rs Cr.
Direction Arrows
Net Sales

Growth in half year ended Sep 2025 is 16.80% vs -1.31% in Sep 2024

Direction Arrows
Consolidated Net Profit

Growth in half year ended Sep 2025 is 4.90% vs 54.58% in Sep 2024

Nine Monthly Results Snapshot (Consolidated) - Dec'25stock-summary

Dec'25
Dec'24
Change(%)
Net Sales
3,895.04
3,284.18
18.60%
Operating Profit (PBDIT) excl Other Income
833.05
692.88
20.23%
Interest
81.66
79.26
3.03%
Exceptional Items
-25.91
0.00
Consolidate Net Profit
393.45
349.48
12.58%
Operating Profit Margin (Excl OI)
21.39%
21.10%
0.29%
Values in Rs Cr.
Direction Arrows
Net Sales

YoY Growth in nine months ended Dec 2025 is 18.60% vs -1.39% in Dec 2024

Direction Arrows
Consolidated Net Profit

YoY Growth in nine months ended Dec 2025 is 12.58% vs 26.78% in Dec 2024

Annual Results Snapshot (Consolidated) - Mar'26stock-summary

Mar'26
Mar'25
Change(%)
Net Sales
5,365.65
4,481.61
19.73%
Operating Profit (PBDIT) excl Other Income
1,185.15
945.24
25.38%
Interest
114.35
103.24
10.76%
Exceptional Items
-10.00
30.75
-132.52%
Consolidate Net Profit
595.02
501.52
18.64%
Operating Profit Margin (Excl OI)
22.20%
21.21%
0.99%
Values in Rs Cr.
Direction Arrows
Net Sales

YoY Growth in year ended Mar 2026 is 19.73% vs -0.55% in Mar 2025

Direction Arrows
Consolidated Net Profit

YoY Growth in year ended Mar 2026 is 18.64% vs 23.74% in Mar 2025

stock-summaryCompany CV
About Granules India Ltd stock-summary
stock-summary
Granules India Ltd
Small Cap
Pharmaceuticals & Biotechnology
Granules India Limited is a large-scale vertically integrated company founded in March 1991 manufacturing Active Pharmaceutical Ingredient (API), Pharmaceutical Formulation Intermediate (PFI) and Finished Dosage (FD). With a strong presence across all three vertical, the company has created a leadership position in the off-patent drugs segment along with ensuring a strong presence in `first line of defense' products such as Paracetamol, Ibuprofen, Metformin and Guaifenesin.
Company Coordinates stock-summary
Company Details
Second Floor Block III, My Home Hub Madhapur Hyderabad Telangana : 500081
stock-summary
Tel: 91-40-66760000
stock-summary
investorrelations@granulesindia.com
Registrar Details
Karvy Computershare Pvt Ltd, Plot No 17-24 , Near Image Hospital,, Reliance Cybervilae,Vithalrao Nagar,, Madhapur, Hyderabad