
Compare Graphite India with Similar Stocks
Stock DNA
Electrodes & Refractories
INR 12,239 Cr (Small Cap)
68.00
41
1.75%
-0.44
3.03%
2.10
Total Returns (Price + Dividend) 
Latest dividend: 11 per share ex-dividend date: Jul-17-2025
Risk Adjusted Returns v/s
Returns Beta

News

Graphite India Ltd. is Rated Sell by MarketsMOJO
Graphite India Ltd. is rated 'Sell' by MarketsMOJO, with this rating last updated on 29 May 2026. However, the analysis and financial metrics discussed here reflect the stock's current position as of 21 June 2026, providing investors with an up-to-date view of the company’s fundamentals, valuation, financial trends, and technical outlook.
Read full news article
Graphite India Ltd. is Rated Sell by MarketsMOJO
Graphite India Ltd. is rated Sell by MarketsMOJO, with this rating last updated on 29 May 2026. However, the analysis and financial metrics discussed here reflect the stock's current position as of 10 June 2026, providing investors with an up-to-date view of the company’s fundamentals, valuation, financial trends, and technical outlook.
Read full news article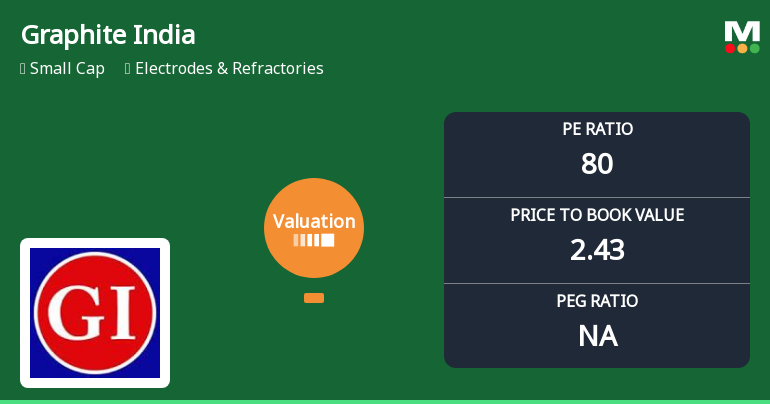
Graphite India Ltd: Valuation Shifts Signal Elevated Risk Amid Price Correction
Graphite India Ltd., a small-cap player in the Electrodes & Refractories sector, has seen a marked deterioration in its valuation parameters, shifting from a previously 'very expensive' status to now being classified as 'risky'. Despite this, the stock has delivered robust returns over multiple time horizons, outperforming the Sensex significantly. This article analyses the recent valuation changes, compares them with peer averages and historical benchmarks, and assesses the implications for investors.
Read full news article Announcements
Announcement under Regulation 30 (LODR)-Analyst / Investor Meet - Intimation
23-Jun-2026 | Source : BSESenior Management of the Company is scheduled to meet representatives of Kotak Mutual Fund (with single Investor) on Wednesday 24th June 2026.
Annual General Meeting
09-Jun-2026 | Source : BSEIntimation for date of Annual General Meeting
Record Date
09-Jun-2026 | Source : BSERecord date for Payment of Dividend
Corporate Actions

No Upcoming Board Meetings

Graphite India Ltd. has declared 350% dividend, ex-date: 20 Jul 26

Graphite India Ltd. has announced 2:10 stock split, ex-date: 11 Dec 06

No Bonus history available

No Rights history available
Quality key factors
Valuation key factors
Technicals key factors
 Technical Indicator Scale: Bearish, Mildly Bearish, Sideways, Mildly Bullish, Bullish Turned
 Shareholding Snapshot : Mar 2026
Shareholding Compare (%holding)
Promoters
None
Held by 22 Schemes (8.61%)
Held by 134 FIIs (6.69%)
Emerald Company Private Limited (61.33%)
Tata Mutual Fund - Tata Small Cap Fund (3.13%)
14.18%
Quarterly Results Snapshot (Consolidated) - Mar'26 - YoY

YoY Growth in quarter ended Mar 2026 is 22.52% vs -7.50% in Mar 2025

YoY Growth in quarter ended Mar 2026 is -308.00% vs 212.50% in Mar 2025
Half Yearly Results Snapshot (Consolidated) - Sep'25
Growth in half year ended Sep 2025 is 1.68% vs -10.97% in Sep 2024
Growth in half year ended Sep 2025 is -51.16% vs -44.19% in Sep 2024
Nine Monthly Results Snapshot (Consolidated) - Dec'25
YoY Growth in nine months ended Dec 2025 is 7.50% vs -15.07% in Dec 2024
YoY Growth in nine months ended Dec 2025 is -32.28% vs -47.98% in Dec 2024
Annual Results Snapshot (Consolidated) - Mar'26
YoY Growth in year ended Mar 2026 is 11.41% vs -13.22% in Mar 2025
YoY Growth in year ended Mar 2026 is -62.12% vs -42.82% in Mar 2025
About Graphite India Ltd.

Company Coordinates


