
Compare GRM Overseas with Similar Stocks
Dashboard
Low ability to service debt as the company has a high Debt to EBITDA ratio of 4.07 times
- Low ability to service debt as the company has a high Debt to EBITDA ratio of 4.07 times
Poor long term growth as Operating profit has grown by an annual rate 6.26% of over the last 5 years
Despite the size of the company, domestic mutual funds hold only 0% of the company
Stock DNA
Other Agricultural Products
INR 2,070 Cr (Small Cap)
25.00
14
0.00%
0.49
12.38%
3.39
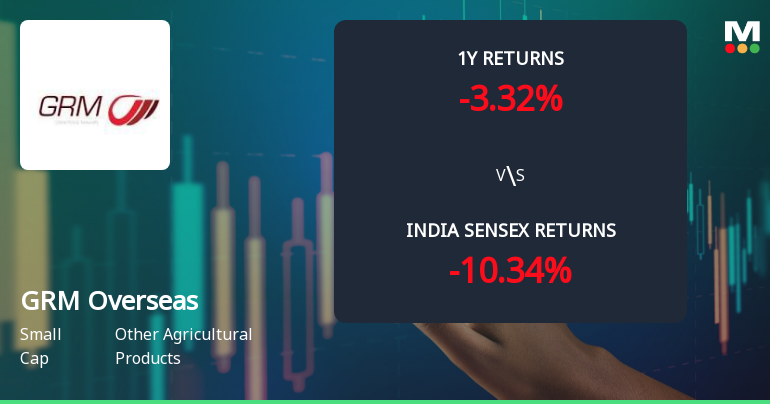
Total Returns (Price + Dividend) 
Latest dividend: 0.2 per share ex-dividend date: Aug-26-2022
Risk Adjusted Returns v/s
Returns Beta

News
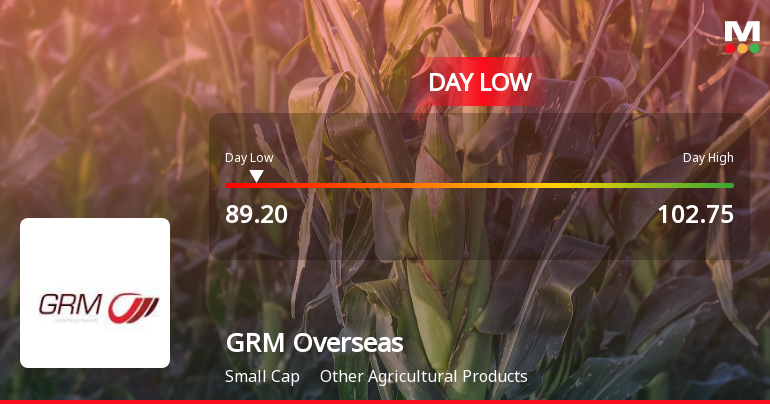
GRM Overseas Ltd Hits Intraday Low Amidst Price Pressure on 10 June 2026
GRM Overseas Ltd witnessed a significant intraday decline on 10 Jun 2026, hitting a fresh 52-week low of Rs. 89.2 as the stock faced intense price pressure and underperformed its sector and broader market indices.
Read full news article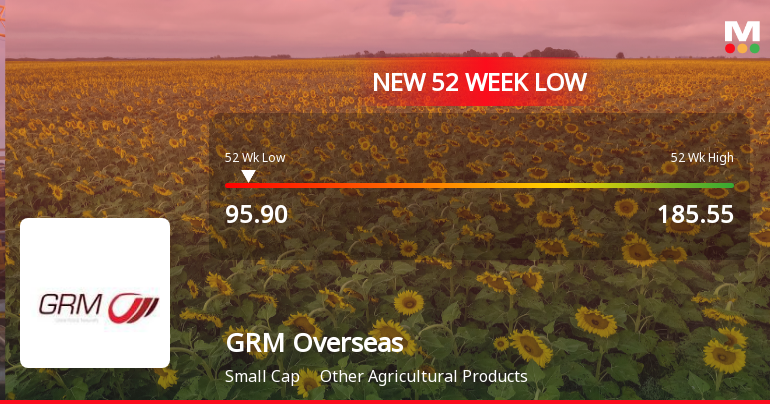
GRM Overseas Ltd Faces Technical Downshift Amid Sharp Price Decline
GRM Overseas Ltd, a small-cap player in the Other Agricultural Products sector, has experienced a significant shift in its technical momentum, reflected in a steep 19.10% drop in its share price on 10 Jun 2026. This downturn follows a recent downgrade in its Mojo Grade from Hold to Sell, signalling growing bearish sentiment among investors and technical analysts alike.
Read full news article Announcements
Disclosures under Reg. 29(2) of SEBI (SAST) Regulations 2011
09-Jun-2026 | Source : BSEThe Exchange has received the disclosure under Regulation 29(2) of SEBI (Substantial Acquisition of Shares & Takeovers) Regulations 2011 for Atul Garg & Others
Announcement under Regulation 30 (LODR)-Newspaper Publication
01-Jun-2026 | Source : BSENewpaper advertisement pursuant of the Audited Financial Results for the Company for the quarter and financial year ended March 31 2026
Announcement under Regulation 30 (LODR)-Investor Presentation
30-May-2026 | Source : BSEInvestor Presentation for the Quarter and Financial year ended March 31 2026
Corporate Actions

No Upcoming Board Meetings

GRM Overseas Ltd has declared 10% dividend, ex-date: 26 Aug 22

GRM Overseas Ltd has announced 2:10 stock split, ex-date: 10 Nov 21

GRM Overseas Ltd has announced 2:1 bonus issue, ex-date: 24 Dec 25

No Rights history available
Quality key factors
Valuation key factors
Technicals key factors
 Technical Indicator Scale: Bearish, Mildly Bearish, Sideways, Mildly Bullish, Bullish Turned
 Shareholding Snapshot : Mar 2026
Shareholding Compare (%holding)
Promoters
None
Held by 0 Schemes
Held by 18 FIIs (9.5%)
Hukam Chand Garg (21.88%)
Ravi Goyal (2.99%)
18.42%
Quarterly Results Snapshot (Consolidated) - Mar'26 - QoQ

QoQ Growth in quarter ended Mar 2026 is 23.70% vs 33.21% in Dec 2025
QoQ Growth in quarter ended Mar 2026 is 12.90% vs 30.56% in Dec 2025
Half Yearly Results Snapshot (Consolidated) - Sep'25
Growth in half year ended Sep 2025 is 0.53% vs 30.82% in Sep 2024

Growth in half year ended Sep 2025 is 24.36% vs 13.13% in Sep 2024
Nine Monthly Results Snapshot (Consolidated) - Dec'25
YoY Growth in nine months ended Dec 2025 is 10.90% vs 16.58% in Dec 2024
YoY Growth in nine months ended Dec 2025 is 30.00% vs 3.06% in Dec 2024
Annual Results Snapshot (Consolidated) - Mar'26
YoY Growth in year ended Mar 2026 is 31.23% vs 2.72% in Mar 2025
YoY Growth in year ended Mar 2026 is 21.39% vs 0.86% in Mar 2025
About GRM Overseas Ltd

Company Coordinates


