Gujarat Alkalies

  • Market Cap: Small Cap
  • Industry: Commodity Chemicals
  • ISIN: INE186A01019
  • NSEID: GUJALKALI
  • BSEID: 530001
INR
674.45
-6.9 (-1.01%)
BSENSE

Aug 07, 03:30 PM

BSE+NSE Vol: 1.36 lacs

  • Price Points
  • Score
  • Mojo Parameters
  • Total Return
  • News and Corporate Actions
  • Key factors
  • Shareholding
  • Financials
  • CompanyCV
stock-summaryPrice Point
High/Low

1Day

52 Week

Valuation
Technical
Day's Volume

CASH

1.36 lacs (-20.93%) Volume

Shareholding (Jun 2026)

FII

3.26%

Held by 56 FIIs

DII

3.02%

Held by 4 DIIs

Promoter

47.28%

Why is Gujarat Alkalies & Chemicals Ltd falling/rising?

09-Aug-2026

As of 08-Aug, Gujarat Alkalies & Chemicals Ltd's stock is experiencing a decline of 1.01% despite a recent strong performance, with reduced investor interest indicated by a 52.53% drop in delivery volume. Long-term growth prospects are concerning due to a significant annual decline in operating profit, contributing to the current price drop.

As of 08-Aug, Gujarat Alkalies & Chemicals Ltd's stock price is currently falling, with a change of -6.9, representing a decline of 1.01%. Despite a strong performance in the past month, where the stock rose by 13.09%, it has underperformed the sector today by 0.91%. The stock reached an intraday high of Rs 700.5 earlier in the day, but the overall trend is negative as indicated by the current price drop.<BR><BR>Investor participation has also decreased, with delivery volume falling by 52.53% compared to the 5-day average, suggesting reduced interest from investors. Although the company has shown impressive growth in net profit and has positive results over the last two quarters, the long-term outlook appears concerning due to a significant annual decline in operating profit of -16.13% over the past five years. Additionally, the stock is trading at a premium compared to its peers, which may contribute to the current price decline. <BR><BR>Overall, while there are positive indicators such as institutional investor participation and a strong return over the past year, the immediate factors of reduced trading volume and poor long-term growth prospects are likely driving the stock's current fall.

View full answer

Should I buy, sell or hold Gujarat Alkalies & Chemicals Ltd?

04-Aug-2026

Are Gujarat Alkalies & Chemicals Ltd latest results good or bad?

24-Jul-2026

Gujarat Alkalies & Chemicals Ltd's latest Q1 FY27 results show a significant net profit increase of 267.02% and record revenue growth, but ongoing low return on equity and negative return on capital employed indicate persistent profitability challenges, suggesting a cautious outlook for investors.

Gujarat Alkalies & Chemicals Ltd's latest results for Q1 FY27 present a mixed picture. On one hand, the company reported a significant recovery in net profit, reaching ₹54.98 crores, which is a remarkable 267.02% increase quarter-on-quarter. Revenue also showed strong growth, rising by 10.63% to ₹1,244.91 crores, marking the highest quarterly revenue in recent history. Additionally, the operating margin improved to 17.81%, a substantial increase from the previous quarter.<BR><BR>However, despite these encouraging figures, the company continues to face structural profitability challenges. The return on equity (ROE) remains low at 3.23%, and the return on capital employed (ROCE) is concerningly negative at -0.17%. These metrics indicate that the company has struggled to generate adequate returns on its investments over time.<BR><BR>Moreover, the company reported a loss in FY25, and while the recent quarterly performance suggests potential stabilization in the chlor-alkali cycle, sustainability remains uncertain due to the volatile nature of the commodity chemicals market. <BR><BR>In summary, while the latest results show positive momentum and recovery, underlying profitability issues and historical performance challenges suggest a cautious outlook. Investors may want to weigh these factors carefully before making decisions.

View full answer

How big is Gujarat Alkalies?

11-Jun-2026

As of 10th June, Gujarat Alkalies & Chemicals Ltd has a market capitalization of 4,712.00 Cr and reported net sales of 4,358.08 Cr, with a net loss of 2.41 Cr in the latest four quarters. Shareholder's funds are at 5,669.58 Cr, and total assets amount to 7,986.63 Cr as of March 2025.

As of 10th June, Gujarat Alkalies & Chemicals Ltd has a market capitalization of 4,712.00 Cr, categorizing it as a Small Cap company.<BR><BR>In the latest four quarters, the company reported net sales of 4,358.08 Cr. However, it experienced a loss of 2.41 Cr in net profit during the same period.<BR><BR>The latest annual period for the balance sheet is March 2025, with shareholder's funds reported at 5,669.58 Cr and total assets amounting to 7,986.63 Cr.

View full answer

Who are in the management team of Gujarat Alkalies?

11-Jun-2026

The management team of Gujarat Alkalies includes Sanjay S Bhatt (Company Secretary), Swaroop P (Managing Director), Hasmukh Adhia (Chairman), and several independent directors, overseeing the company's operations and strategic direction.

The management team of Gujarat Alkalies includes the following individuals:<BR><BR>1. **Sanjay S Bhatt** - Company Secretary & Compliance Officer<BR>2. **Rajiv Lochan Jain** - Independent Director<BR>3. **S B Dangayach** - Independent Director<BR>4. **Jagdish Prasad Gupta** - Executive Director<BR>5. **Nitin Shukla** - Independent Director<BR>6. **Shridevi Shukla** - Independent Director<BR>7. **Swaroop P** - Managing Director<BR>8. **Hasmukh Adhia** - Chairman (Non-Executive)<BR>9. **Rahul B Gupta** - Additional Director<BR>10. **Jorg Nohl** - Additional Director<BR><BR>This team plays a crucial role in overseeing the company's operations and strategic direction.

View full answer

Who are the peers of the Gujarat Alkalies?

11-Jun-2026

Peers of Gujarat Alkalies include Tata Chemicals, India Glycols, GHCL, Tanfac Inds., Chemplast Sanmar, and others. Management risk varies from excellent at GHCL and Chemplast Sanmar to below average at Fischer Medical, with Tanfac Inds. showing the highest 1-year return at 20.11% and Chemplast Sanmar the lowest at -54.65%.

Peers: The peers of Gujarat Alkalies are Tata Chemicals, India Glycols, GHCL, Tanfac Inds., Grauer & Weil, Chemplast Sanmar, Fischer Medical, Thirumalai Chem., and J.G.Chemicals.<BR><BR>Quality Snapshot: Excellent management risk is observed at GHCL and Chemplast Sanmar, while Average management risk is found at Tata Chemicals, India Glycols, Gujarat Alkalies, Tanfac Inds., Grauer & Weil, Thirumalai Chem., and J.G.Chemicals, and Below Average management risk is noted at Fischer Medical. Growth is rated as Excellent for Fischer Medical, Good for Tanfac Inds. and J.G.Chemicals, and Below Average for Tata Chemicals, India Glycols, Gujarat Alkalies, GHCL, Grauer & Weil, Thirumalai Chem. and the rest. Capital Structure is Excellent for Gujarat Alkalies, GHCL, Tanfac Inds., Grauer & Weil, and J.G.Chemicals, Average for Tata Chemicals, India Glycols, and the rest, and Below Average for Chemplast Sanmar and Thirumalai Chem.<BR><BR>Return Snapshot: The peer with the highest 1-year return is Tanfac Inds. at 20.11%, while the peer with the lowest is Chemplast Sanmar at -54.65%. Gujarat Alkalies has a 1-year return of 2.82%, which is higher than Chemplast Sanmar but lower than Tanfac Inds. Additionally, the six-month return is negative for GHCL, Chemplast Sanmar, Fischer Medical, Thirumalai Chem., and the rest.

View full answer

What does Gujarat Alkalies do?

10-Jun-2026

Gujarat Alkalies and Chemicals Ltd (GACL) is a leading producer of Caustic Soda Lye in India, holding a 13% market share in the Chlor-alkali sector. As of March 2026, it reported net sales of ₹1,125 Cr and a net profit of ₹15 Cr, with a market cap of ₹4,712 Cr.

Overview:<BR>Gujarat Alkalies and Chemicals Ltd (GACL) is one of the largest producers of Caustic Soda Lye in India, operating within the Commodity Chemicals industry and classified as a Small Cap company.<BR><BR>History:<BR>Gujarat Alkalies and Chemicals Ltd was incorporated in an unspecified year and has maintained its status as a leading producer in the Chlor-alkali market, holding approximately 13% market share. The latest quarterly results reported are for March 2026, showing net sales and profit figures.<BR><BR>Financial Snapshot:<BR>Net Sales: 1,125 Cr (Quarterly Results - Mar 2026) <BR>Net Profit: 15 Cr (Quarterly Results - Mar 2026) <BR>Market Cap: INR 4,712 Cr (Small Cap)<BR><BR>Key Metrics:<BR>P/E: N/A <BR>Industry P/E: 42 <BR>Dividend Yield: 2.50% <BR>Debt-Equity: 0.07 <BR>Return on Equity: -0.05% <BR>Price to Book: 0.89 <BR><BR>Contact Details:<BR>Address: PO Petrochemicals, Vadodara Gujarat: 391346 <BR>Tel: 91-265-2232681-82/2232981-82/701 <BR>Email: investor_relations@gacl.co.in <BR>Website: http://www.gacl.com

View full answer

When is the next results date for Gujarat Alkalies & Chemicals Ltd?

19-May-2026

The next results date for Gujarat Alkalies & Chemicals Ltd is 29 May 2026.

The next results date for Gujarat Alkalies & Chemicals Ltd is scheduled for 29 May 2026.

View full answer

Is Gujarat Alkalies overvalued or undervalued?

11-Nov-2025

As of November 10, 2025, Gujarat Alkalies is considered undervalued with a valuation grade shift to very attractive, reflected by a high PE ratio of 27029.69, a reasonable EV to EBITDA of 10.28, and a low Price to Book Value of 0.07, especially when compared to peers like Solar Industries and Godrej Industries, despite its year-to-date stock performance lagging behind the Sensex.

As of 10 November 2025, the valuation grade for Gujarat Alkalies has moved from very expensive to very attractive. This indicates a significant reassessment of the company's value, suggesting it is currently undervalued. Key ratios reflect this: the PE ratio stands at an extraordinarily high 27029.69, while the EV to EBITDA is a more reasonable 10.28, and the Price to Book Value is notably low at 0.07.<BR><BR>In comparison to peers, Gujarat Alkalies appears to be in a favorable position despite its high PE ratio. For instance, Solar Industries has a PE of 96.11 and an EV to EBITDA of 59.13, while Godrej Industries shows a PE of 35.42 and an EV to EBITDA of 28.71. These comparisons further support the conclusion that Gujarat Alkalies is undervalued relative to its peers. Additionally, the company's recent stock performance has lagged behind the Sensex, with a year-to-date return of -26.40% compared to the Sensex's 6.91%, reinforcing the notion that it may be undervalued in the current market.

View full answer

Is Gujarat Alkalies technically bullish or bearish?

11-Nov-2025

As of November 10, 2025, Gujarat Alkalies shows a bearish trend with moderate strength, indicated by bearish daily moving averages and Bollinger Bands, despite mixed signals from the MACD and KST.

As of 10 November 2025, the technical trend has changed from mildly bearish to bearish. The current technical stance for Gujarat Alkalies is bearish with moderate strength. Key indicators driving this stance include the bearish signals from the daily moving averages and the Bollinger Bands on both weekly and monthly time frames. The MACD shows a mildly bullish signal on the weekly chart but remains bearish on the monthly, which adds to the mixed signals. The KST also reflects a mildly bullish stance on the weekly but is bearish on the monthly, indicating a lack of strong upward momentum. Overall, the combination of these indicators suggests a bearish outlook for the stock.

View full answer

How has been the historical performance of Gujarat Alkalies?

09-Nov-2025

Gujarat Alkalies' historical performance shows fluctuating net sales, peaking at 4,516.50 Cr in Mar'23 and declining to 4,072.91 Cr in Mar'25, with an operating profit of 360.42 Cr in Mar'25. Despite improvements in profit before tax and profit after tax, the consolidated net profit remained negative at -65.12 Cr.

Answer:<BR>The historical performance of Gujarat Alkalies shows a fluctuating trend in net sales, with figures reaching 4,072.91 Cr in Mar'25, up from 3,806.63 Cr in Mar'24, but down from 4,516.50 Cr in Mar'23. The total operating income mirrored this trend, reflecting similar values. The company's total expenditure increased to 3,712.49 Cr in Mar'25 from 3,670.60 Cr in Mar'24, leading to an operating profit (PBDIT) of 360.42 Cr, a significant rise from 136.03 Cr in the previous year. However, the profit before tax showed a stark decline to 9.72 Cr in Mar'25 from a loss of 195.88 Cr in Mar'24, while profit after tax improved to 15.82 Cr from a loss of 132.24 Cr. Despite these improvements, the consolidated net profit remained negative at -65.12 Cr in Mar'25, although it was an improvement from -236.84 Cr in Mar'24. The earnings per share (EPS) reflected this trend, showing -8.87 in Mar'25 compared to -32.25 in Mar'24.<BR><BR>Breakdown:<BR>Gujarat Alkalies experienced a volatile financial performance over the years, with net sales peaking at 4,516.50 Cr in Mar'23 before declining to 4,072.91 Cr in Mar'25. The total operating income followed a similar pattern, while total expenditure rose, resulting in an operating profit of 360.42 Cr in Mar'25, a notable increase from the previous year. The profit before tax turned positive at 9.72 Cr, contrasting with the significant loss of 195.88 Cr in Mar'24, and profit after tax also improved to 15.82 Cr. However, the consolidated net profit remained negative at -65.12 Cr, despite being less severe than the prior year's loss. The EPS showed a similar recovery trend, moving from -32.25 to -8.87, indicating some operational recovery, although the overall financial health remains challenged.

View full answer

Who are the top shareholders of the Gujarat Alkalies?

17-Jul-2025

The top shareholders of Gujarat Alkalies include Gujarat State Investments Limited with 20.87%, Lok Prakashan Ltd at 22.08%, five mutual fund schemes holding 2.68%, and 72 foreign institutional investors with a combined 1.71%. Individual investors own 16.26% of the company.

The top shareholders of Gujarat Alkalies include Gujarat State Investments Limited, which holds the highest promoter stake at 20.87%. Additionally, Lok Prakashan Ltd is the largest public shareholder with a holding of 22.08%. The company also has 5 mutual fund schemes collectively holding 2.68%, and 72 foreign institutional investors (FIIs) with a combined holding of 1.71%. Individual investors own 16.26% of the company.

View full answer

Has Gujarat Alkalies declared dividend?

06-Jun-2025

Yes, Gujarat Alkalies & Chemicals Ltd has declared a 138% dividend, amounting to ₹13.8 per share, with an ex-date of September 19, 2024. While the company shows strong total returns over the 4- and 5-year periods, recent performance has been mixed, with negative returns in the shorter terms.

Gujarat Alkalies & Chemicals Ltd has declared a 138% dividend.<BR><BR>Dividend Details:<BR>- Percentage announced: 138%<BR>- Amount per share: 13.8<BR>- Ex-date: 19 Sep 24<BR><BR>Dividend Yield: 2.33%.<BR><BR>Total Returns by Period:<BR>Over the last 6 months, the price return was -25.33%, with no dividend return, resulting in a total return of -25.33%.<BR><BR>In the past year, the price return was -18.05%, with a dividend return of 1.80%, leading to a total return of -16.25%.<BR><BR>Over the last 2 years, the price return was -9.22%, with a dividend return of 5.48%, resulting in a total return of -3.74%.<BR><BR>In the last 3 years, the price return was -26.79%, while the dividend return was 7.13%, culminating in a total return of -19.66%.<BR><BR>For the 4-year period, the price return was 46.51%, with a dividend return of 13.59%, yielding a total return of 60.1%.<BR><BR>Over the last 5 years, the price return was 77.67%, and the dividend return was 19.31%, resulting in a total return of 96.98%.<BR><BR>Overall, while Gujarat Alkalies has declared a significant dividend, the total returns over various periods show a mix of negative and positive performance, particularly highlighting strong returns over the longer 4- and 5-year periods.

View full answer
iScoreScore
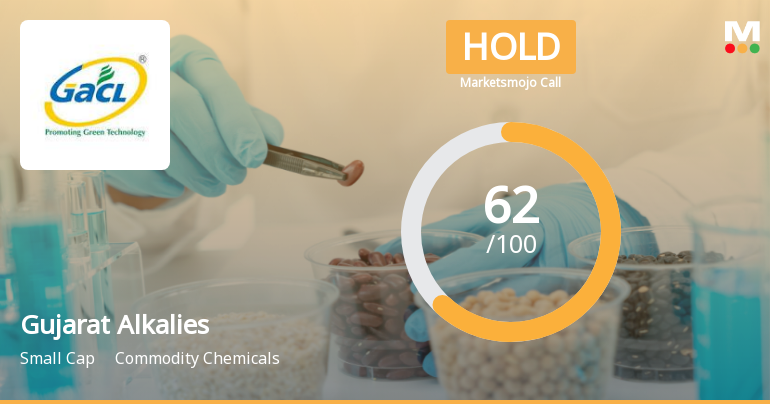
Click here to find our call on this stock
Strong Sell
Sell
Hold
Buy
Strong Buy

Dashboard

1

Company has a Debt to Equity ratio (avg) of 0.05 times

 
2

With a growth in Net Profit of 573.39%, the company declared Very Positive results in Jun 26

3

Increasing Participation by Institutional Investors

4

Market Beating Performance

stock-summaryMojo Parameters

Mojo Parameters

Loading Valuation Snapshot...

Stock DNA

stock-summary
Industry

Commodity Chemicals

stock-summary
Market cap

INR 5,089 Cr (Small Cap)

stock-summary
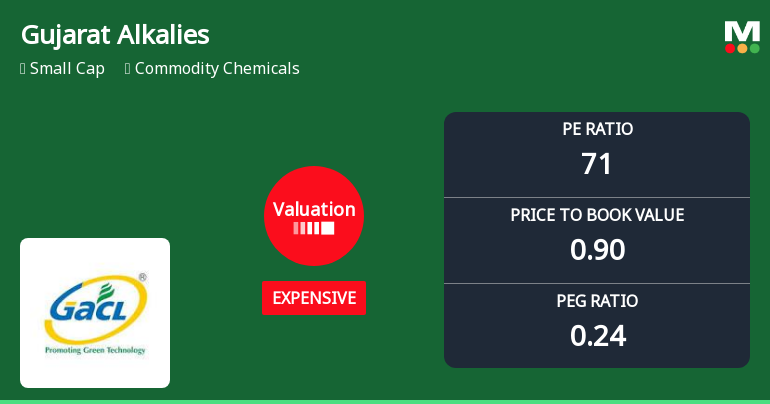
P/E

75.00

stock-summary
Industry P/E

44

stock-summary
Dividend Yield

2.33%

stock-summary
Debt Equity

0.07

stock-summary
Return on Equity

-0.05%

stock-summary
Price to Book

0.96

Revenue and Profits:
Net Sales:
1,245 Cr
(Quarterly Results - Jun 2026)
Net Profit:
55 Cr
stock-summaryTotal Returns
Total Returns (Price + Dividend) stock-summary
Dividend Yield (2.33%)
TimePeriod
Price Return
Dividend Return
Total Return
3 Months
-14.72%
0%
-14.72%
6 Months
43.85%
0%
43.85%
1 Year
17.48%
2.87%
20.35%
2 Years
-9.72%
4.00%
-5.72%
3 Years
0.62%
8.14%
8.76%
4 Years
-10.54%
7.11%
-3.43%
5 Years
32.0%
15.60%
47.6%

Latest dividend: 15.800000000000002 per share ex-dividend date: Sep-19-2025

Risk Adjusted Returns v/s stock-summary
Returns Beta
Icon
Beta has not been calculated since enough price history is not available
stock-summaryNews & Corporate Actions

News

Gujarat Alkalies & Chemicals Gains 0.27%: 2 Key Factors Driving the Week

Announcements stock-summary

Announcement under Regulation 30 (LODR)-Investor Presentation

07-Aug-2026 | Source : BSE

We have uploaded an updated Investors Presentation on Companys website for the benefit of Investors/Shareholders at large. For more details kindly refer attached file.

Announcement under Regulation 30 (LODR)-Credit Rating

04-Aug-2026 | Source : BSE

In addition to the letter dated 30.07.2026 submitted by the Company we are enclosing herewith the rationale for the Ratings issued by the CareEdge Rating Agency. For more details kindly refer attached file.

Announcement under Regulation 30 (LODR)-Credit Rating

30-Jul-2026 | Source : BSE

We are enclosing herewith Credit Rating reports issued by CARE Ratings Limited. For more details kindly refer attached file.

Corporate Actions stock-summary

stock-summary
BOARD MEETING

No Upcoming Board Meetings

stock-summary
DIVIDEND

Gujarat Alkalies & Chemicals Ltd has declared 158% dividend, ex-date: 19 Sep 25

stock-summary
SPLITS

No Splits history available

stock-summary
BONUS

No Bonus history available

stock-summary
RIGHTS

No Rights history available

stock-summaryKey Factors

Quality key factors stock-summary

Factor
Value
Sales Growth (5y)
10.94%
EBIT Growth (5y)
-16.13%
EBIT to Interest (avg)
40.64
Debt to EBITDA (avg)
1.57
Net Debt to Equity (avg)
0.07
Sales to Capital Employed (avg)
0.63
Tax Ratio
54.04%
Dividend Payout Ratio
-178.19%
Pledged Shares
0
Institutional Holding
6.28%
ROCE (avg)
4.48%
ROE (avg)
3.23%

Valuation key factors

Factor
Value
P/E Ratio
75
Industry P/E
44
Price to Book Value
0.95
EV to EBIT
56.45
EV to EBITDA
10.46
EV to Capital Employed
0.96
EV to Sales
1.19
PEG Ratio
0.25
Dividend Yield
2.34%
ROCE (Latest)
-0.17%
ROE (Latest)
-0.05%

Technicals key factors

Indicator
Weekly
Monthly
MACD
Mildly Bearish
Mildly Bullish
RSI
No Signal
No Signal
Bollinger Bands
Bullish
Bullish
Moving Averages
Bullish (Daily)
KST
Mildly Bearish
Mildly Bullish
Dow Theory
Mildly Bullish
Mildly Bullish
OBV
Mildly Bullish
Mildly Bullish
stock-summary Technical Indicator Scale: Bearish, Mildly Bearish, Sideways, Mildly Bullish, Bullish  Turned 
stock-summaryShareholding
Shareholding Snapshot : Jun 2026stock-summary
Shareholding Compare (%holding) stock-summary
Majority shareholders

Promoters

Pledged Promoter Holdings

None

Mutual Funds

Held by 5 Schemes (1.35%)

FIIs

Held by 56 FIIs (3.26%)

Promoter with highest holding

Gujarat State Investments Limited (20.87%)

Highest Public shareholder

Lok Prakashan Ltd (22.15%)

Individual Investors Holdings

15.03%

stock-summaryFinancial
[
  {
    "link": "quarterly",
    "btn_text": "All Quarterly Results",
    "header": "Quarterly Results Snapshot (Consolidated) - Jun'26 - QoQ",
    "rhs": [
      {
        "prefix": "Net Sales ",
        "suffix": "QoQ Growth in quarter ended Jun 2026 is 10.63% vs 7.74% in Mar 2026",
        "dir": 1
      },
      {
        "prefix": "Consolidated Net Profit ",
        "suffix": "QoQ Growth in quarter ended Jun 2026 is 267.02% vs 175.09% in Mar 2026",
        "dir": 1
      }
    ],
    "table": {
      "header": [
        "Jun'26",
        "Mar'26",
        "Change(%)"
      ],
      "body": [
        {
          "field": "Net Sales",
          "val1": "1,244.91",
          "val2": "1,125.31",
          "chgp": "10.63%",
          "chgp_class": "positive"
        },
        {
          "field": "Operating Profit (PBDIT) excl Other Income",
          "val1": "221.68",
          "val2": "109.89",
          "chgp": "101.73%",
          "chgp_class": "positive"
        },
        {
          "field": "Interest",
          "val1": "16.16",
          "val2": "15.46",
          "chgp": "4.53%",
          "chgp_class": "negative"
        },
        {
          "field": "Exceptional Items",
          "val1": "0.00",
          "val2": "0.00",
          "chgp": "",
          "chgp_class": "neutral"
        },
        {
          "field": "Consolidate Net Profit",
          "val1": "54.98",
          "val2": "14.98",
          "chgp": "267.02%",
          "chgp_class": "positive"
        },
        {
          "field": "Operating Profit Margin (Excl OI)",
          "val1": "17.81%",
          "val2": "9.77%",
          "chgp": "8.04%",
          "chgp_class": "positive"
        }
      ]
    }
  },
  {
    "link": "half-yearly",
    "btn_text": "All Half Yearly Results",
    "header": "Half Yearly Results Snapshot (Consolidated) - Sep'25",
    "rhs": [
      {
        "prefix": "Net Sales ",
        "suffix": " Growth in half year ended Sep 2025 is 11.19% vs 4.45% in Sep 2024",
        "dir": 1
      },
      {
        "prefix": "Consolidated Net Profit ",
        "suffix": " Growth in half year ended Sep 2025 is 104.08% vs 16.97% in Sep 2024",
        "dir": 1
      }
    ],
    "table": {
      "header": [
        "Sep'25",
        "Sep'24",
        "Change(%)"
      ],
      "body": [
        {
          "field": "Net Sales",
          "val1": "2,188.31",
          "val2": "1,968.03",
          "chgp": "11.19%",
          "chgp_class": "positive"
        },
        {
          "field": "Operating Profit (PBDIT) excl Other Income",
          "val1": "190.52",
          "val2": "148.67",
          "chgp": "28.15%",
          "chgp_class": "positive"
        },
        {
          "field": "Interest",
          "val1": "29.44",
          "val2": "21.91",
          "chgp": "34.37%",
          "chgp_class": "negative"
        },
        {
          "field": "Exceptional Items",
          "val1": "0.00",
          "val2": "0.00",
          "chgp": "",
          "chgp_class": "neutral"
        },
        {
          "field": "Consolidate Net Profit",
          "val1": "2.56",
          "val2": "-62.71",
          "chgp": "104.08%",
          "chgp_class": "positive"
        },
        {
          "field": "Operating Profit Margin (Excl OI)",
          "val1": "8.71%",
          "val2": "7.55%",
          "chgp": "1.16%",
          "chgp_class": "positive"
        }
      ]
    }
  },
  {
    "link": "nine-monthly",
    "btn_text": "All Nine Monthly Results",
    "header": "Nine Monthly Results Snapshot (Consolidated) - Dec'25",
    "rhs": [
      {
        "prefix": "Net Sales ",
        "suffix": "YoY Growth in nine months ended Dec 2025 is 7.85% vs 6.86% in Dec 2024",
        "dir": 1
      },
      {
        "prefix": "Consolidated Net Profit ",
        "suffix": "YoY Growth in nine months ended Dec 2025 is 76.48% vs 61.22% in Dec 2024",
        "dir": 1
      }
    ],
    "table": {
      "header": [
        "Dec'25",
        "Dec'24",
        "Change(%)"
      ],
      "body": [
        {
          "field": "Net Sales",
          "val1": "3,232.77",
          "val2": "2,997.44",
          "chgp": "7.85%",
          "chgp_class": "positive"
        },
        {
          "field": "Operating Profit (PBDIT) excl Other Income",
          "val1": "295.32",
          "val2": "246.67",
          "chgp": "19.72%",
          "chgp_class": "positive"
        },
        {
          "field": "Interest",
          "val1": "47.92",
          "val2": "32.35",
          "chgp": "48.13%",
          "chgp_class": "negative"
        },
        {
          "field": "Exceptional Items",
          "val1": "0.00",
          "val2": "0.00",
          "chgp": "",
          "chgp_class": "neutral"
        },
        {
          "field": "Consolidate Net Profit",
          "val1": "-17.39",
          "val2": "-73.94",
          "chgp": "76.48%",
          "chgp_class": "positive"
        },
        {
          "field": "Operating Profit Margin (Excl OI)",
          "val1": "9.14%",
          "val2": "8.23%",
          "chgp": "0.91%",
          "chgp_class": "positive"
        }
      ]
    }
  },
  {
    "link": "annual",
    "btn_text": "All Annual Results",
    "header": "Annual Results Snapshot (Consolidated) - Mar'26",
    "rhs": [
      {
        "prefix": "Net Sales ",
        "suffix": "YoY Growth in year ended Mar 2026 is 7.00% vs 7.00% in Mar 2025",
        "dir": 0
      },
      {
        "prefix": "Consolidated Net Profit ",
        "suffix": "YoY Growth in year ended Mar 2026 is 96.30% vs 72.50% in Mar 2025",
        "dir": 1
      }
    ],
    "table": {
      "header": [
        "Mar'26",
        "Mar'25",
        "Change(%)"
      ],
      "body": [
        {
          "field": "Net Sales",
          "val1": "4,358.08",
          "val2": "4,072.91",
          "chgp": "7.00%",
          "chgp_class": "positive"
        },
        {
          "field": "Operating Profit (PBDIT) excl Other Income",
          "val1": "405.21",
          "val2": "360.42",
          "chgp": "12.43%",
          "chgp_class": "positive"
        },
        {
          "field": "Interest",
          "val1": "63.38",
          "val2": "50.54",
          "chgp": "25.41%",
          "chgp_class": "negative"
        },
        {
          "field": "Exceptional Items",
          "val1": "0.00",
          "val2": "0.00",
          "chgp": "",
          "chgp_class": "neutral"
        },
        {
          "field": "Consolidate Net Profit",
          "val1": "-2.41",
          "val2": "-65.12",
          "chgp": "96.30%",
          "chgp_class": "positive"
        },
        {
          "field": "Operating Profit Margin (Excl OI)",
          "val1": "9.30%",
          "val2": "8.85%",
          "chgp": "0.45%",
          "chgp_class": "positive"
        }
      ]
    }
  }
]

Quarterly Results Snapshot (Consolidated) - Jun'26 - QoQstock-summary

Jun'26
Mar'26
Change(%)
Net Sales
1,244.91
1,125.31
10.63%
Operating Profit (PBDIT) excl Other Income
221.68
109.89
101.73%
Interest
16.16
15.46
4.53%
Exceptional Items
0.00
0.00
Consolidate Net Profit
54.98
14.98
267.02%
Operating Profit Margin (Excl OI)
17.81%
9.77%
8.04%
Values in Rs Cr.
Direction Arrows
Net Sales

QoQ Growth in quarter ended Jun 2026 is 10.63% vs 7.74% in Mar 2026

Direction Arrows
Consolidated Net Profit

QoQ Growth in quarter ended Jun 2026 is 267.02% vs 175.09% in Mar 2026

Half Yearly Results Snapshot (Consolidated) - Sep'25stock-summary

Sep'25
Sep'24
Change(%)
Net Sales
2,188.31
1,968.03
11.19%
Operating Profit (PBDIT) excl Other Income
190.52
148.67
28.15%
Interest
29.44
21.91
34.37%
Exceptional Items
0.00
0.00
Consolidate Net Profit
2.56
-62.71
104.08%
Operating Profit Margin (Excl OI)
8.71%
7.55%
1.16%
Values in Rs Cr.
Direction Arrows
Net Sales

Growth in half year ended Sep 2025 is 11.19% vs 4.45% in Sep 2024

Direction Arrows
Consolidated Net Profit

Growth in half year ended Sep 2025 is 104.08% vs 16.97% in Sep 2024

Nine Monthly Results Snapshot (Consolidated) - Dec'25stock-summary

Dec'25
Dec'24
Change(%)
Net Sales
3,232.77
2,997.44
7.85%
Operating Profit (PBDIT) excl Other Income
295.32
246.67
19.72%
Interest
47.92
32.35
48.13%
Exceptional Items
0.00
0.00
Consolidate Net Profit
-17.39
-73.94
76.48%
Operating Profit Margin (Excl OI)
9.14%
8.23%
0.91%
Values in Rs Cr.
Direction Arrows
Net Sales

YoY Growth in nine months ended Dec 2025 is 7.85% vs 6.86% in Dec 2024

Direction Arrows
Consolidated Net Profit

YoY Growth in nine months ended Dec 2025 is 76.48% vs 61.22% in Dec 2024

Annual Results Snapshot (Consolidated) - Mar'26stock-summary

Mar'26
Mar'25
Change(%)
Net Sales
4,358.08
4,072.91
7.00%
Operating Profit (PBDIT) excl Other Income
405.21
360.42
12.43%
Interest
63.38
50.54
25.41%
Exceptional Items
0.00
0.00
Consolidate Net Profit
-2.41
-65.12
96.30%
Operating Profit Margin (Excl OI)
9.30%
8.85%
0.45%
Values in Rs Cr.
Net Sales

YoY Growth in year ended Mar 2026 is 7.00% vs 7.00% in Mar 2025

Direction Arrows
Consolidated Net Profit

YoY Growth in year ended Mar 2026 is 96.30% vs 72.50% in Mar 2025

stock-summaryCompany CV
About Gujarat Alkalies & Chemicals Ltd stock-summary
stock-summary
Gujarat Alkalies & Chemicals Ltd
Small Cap
Commodity Chemicals
Gujarat Alkalies and Chemicals Ltd (GACL) is one of the largest producers of Caustic Soda Lye in India with installed production capacity of 4,75,224 MT as on 31 March 2023. The company has about 13% share in the domestic Chlor-alkali market.
Company Coordinates stock-summary
Company Details
PO Petrochemicals , Vadodara Gujarat : 391346
stock-summary
Tel: 91-265-2232681-82/2232981-82/701
stock-summary
investor_relations@gacl.co.in
Registrar Details
MCS Ltd , Neelam Apartment , 88 Sampatrao Colony, Above Chappan Bhog Sweets, Vadodara