
Compare Guj Inds. Power with Similar Stocks
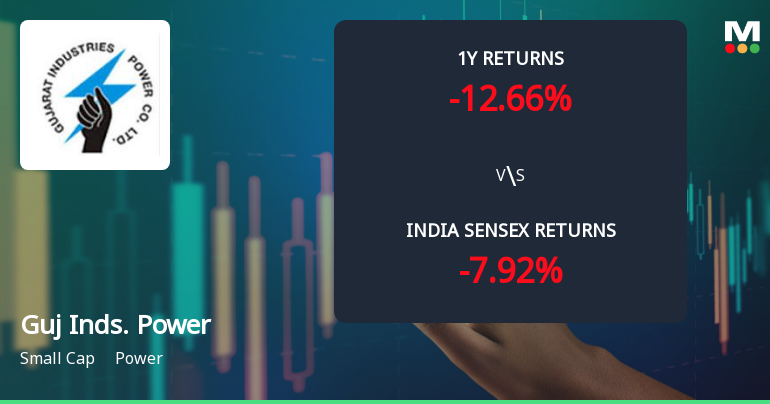
Total Returns (Price + Dividend) 
Latest dividend: 4 per share ex-dividend date: Sep-12-2025
Risk Adjusted Returns v/s
Returns Beta

News
Gujarat Industries Power Co Ltd Technical Momentum Shifts Amid Mixed Indicator Signals
Gujarat Industries Power Co Ltd (Guj Inds. Power) has experienced a notable shift in its technical momentum, moving from a mildly bearish stance to a sideways trend. Despite a recent downgrade in its Mojo Grade from Hold to Sell, the stock exhibits a complex interplay of bullish and bearish signals across key technical indicators, reflecting a nuanced outlook for investors in the power sector.
Read full news article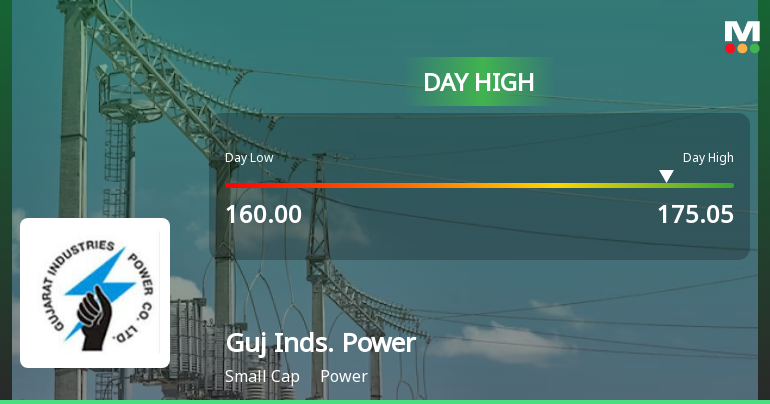
Gujarat Industries Power Co Ltd Surges 7.36% to Day's High of Rs 175.05 — Outperforms Sector by 7.6 Percentage Points
The Sensex rose 0.63% after a volatile session, yet Gujarat Industries Power Co Ltd outpaced the broader market with a 7.36% gain, touching an intraday high of Rs 175.05. This 7.6-percentage-point outperformance over the Power sector signals a distinctly stock-specific rally rather than a market-wide lift.
Read full news article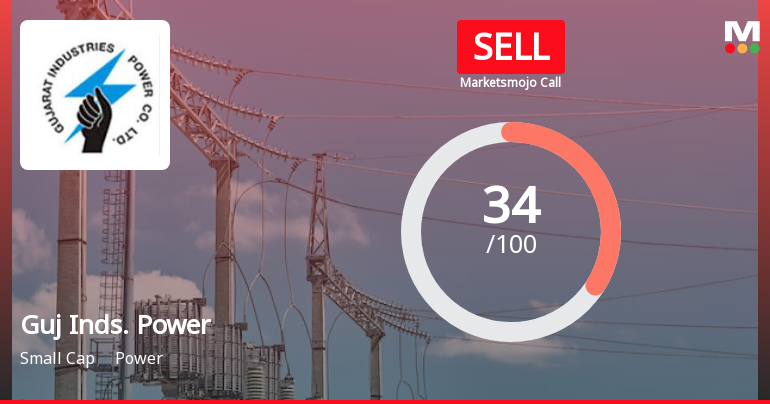
Gujarat Industries Power Co Ltd Downgraded to Sell Amid Mixed Financial and Technical Signals
Gujarat Industries Power Co Ltd has seen its investment rating downgraded from Hold to Sell, reflecting a complex interplay of improved financial trends but deteriorating quality metrics and cautious technical signals. Despite a strong quarterly performance in March 2026, concerns over long-term fundamentals and valuation have weighed on the stock, prompting a reassessment of its investment appeal.
Read full news article Announcements
Announcement under Regulation 30 (LODR)-Newspaper Publication
04-Jun-2026 | Source : BSENewspaper publication regarding opening of another special window and 100 days campaign - Saksham Niveshak.
Announcement under Regulation 30 (LODR)-Newspaper Publication
01-Jun-2026 | Source : BSEIntimation regarding newspaper publication of notice of transfer of equity shares of the Company to IEPF Account.
Updates
30-May-2026 | Source : BSERegarding reminder letter sent to Shareholders pertaining to transfer of Equity Shares to IEPF Authority.
Corporate Actions

No Upcoming Board Meetings

Gujarat Industries Power Co Ltd has declared 40% dividend, ex-date: 12 Sep 25

No Splits history available

No Bonus history available

No Rights history available
Quality key factors
Valuation key factors
Technicals key factors
 Technical Indicator Scale: Bearish, Mildly Bearish, Sideways, Mildly Bullish, Bullish Turned
 Shareholding Snapshot : Mar 2026
Shareholding Compare (%holding)
Promoters
None
Held by 5 Schemes (4.37%)
Held by 38 FIIs (2.74%)
Gujarat Urja Vikas Nigam Limited (24.73%)
Hdfc Trustee Company Ltd. A/c Hdfc Balanced Advantage Fund (4.08%)
22.21%
Quarterly Results Snapshot (Standalone) - Mar'26 - QoQ

QoQ Growth in quarter ended Mar 2026 is 15.76% vs 15.10% in Dec 2025
QoQ Growth in quarter ended Mar 2026 is 10,314.06% vs -115.02% in Dec 2025
Half Yearly Results Snapshot (Standalone) - Sep'25
Growth in half year ended Sep 2025 is 16.26% vs -4.24% in Sep 2024

Growth in half year ended Sep 2025 is -23.16% vs 19.58% in Sep 2024
Nine Monthly Results Snapshot (Standalone) - Dec'25
YoY Growth in nine months ended Dec 2025 is 15.78% vs -5.94% in Dec 2024
YoY Growth in nine months ended Dec 2025 is -46.68% vs 7.07% in Dec 2024
Annual Results Snapshot (Standalone) - Mar'26
YoY Growth in year ended Mar 2026 is 18.70% vs -6.85% in Mar 2025
YoY Growth in year ended Mar 2026 is 90.33% vs 6.51% in Mar 2025
About Gujarat Industries Power Co Ltd

Company Coordinates


