
Compare Gulshan Polyols with Similar Stocks
Dashboard
Low ability to service debt as the company has a high Debt to EBITDA ratio of 1.36 times
- Poor long term growth as Operating profit has grown by an annual rate 13.52% of over the last 5 years
- Low ability to service debt as the company has a high Debt to EBITDA ratio of 1.36 times
- The company has been able to generate a Return on Equity (avg) of 5.17% signifying low profitability per unit of shareholders funds
Poor long term growth as Operating profit has grown by an annual rate 13.52% of over the last 5 years
The company has declared Positive results for the last 4 consecutive quarters
With ROCE of 8.5, it has a Attractive valuation with a 1.6 Enterprise value to Capital Employed
Stock DNA
Other Agricultural Products
INR 1,285 Cr (Micro Cap)
30.00
42
0.15%
0.68
6.66%
2.00
Total Returns (Price + Dividend) 
Latest dividend: 0.3 per share ex-dividend date: Sep-11-2025
Risk Adjusted Returns v/s
Returns Beta

News
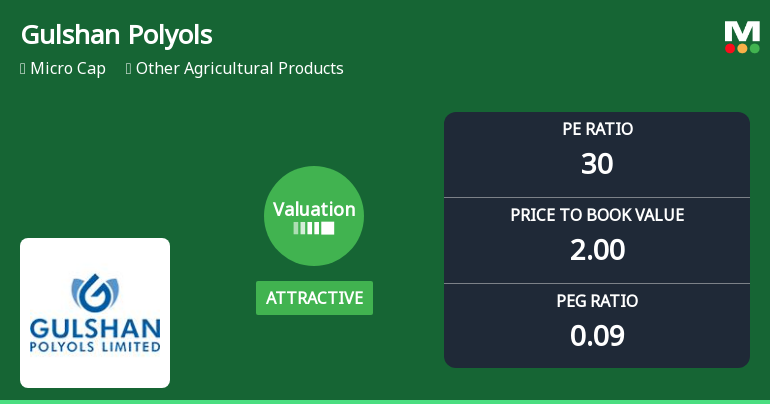
Gulshan Polyols Ltd Valuation Shifts Signal Renewed Price Attractiveness
Gulshan Polyols Ltd, a micro-cap player in the Other Agricultural Products sector, has seen its valuation metrics shift favourably, moving from a fair to an attractive rating. Despite a recent 4.8% dip in share price, the company’s price-to-earnings (P/E) and price-to-book value (P/BV) ratios now present a compelling case for investors seeking value in a volatile market environment.
Read full news article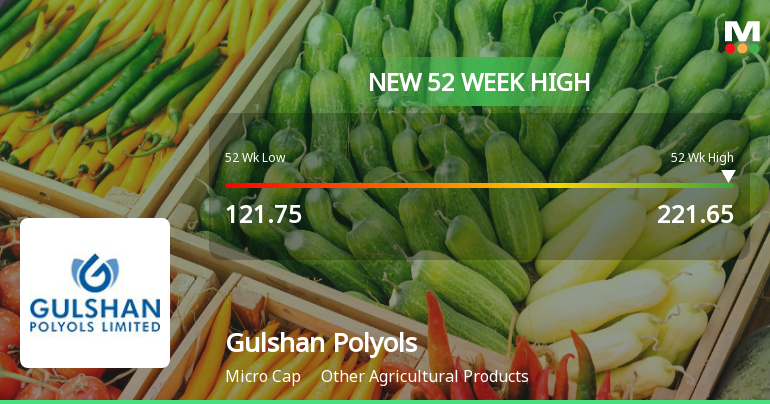
Broad-Based Technical Strength Lifts Gulshan Polyols Ltd to 52-Week High of Rs 221.7
Surging past its previous highs, Gulshan Polyols Ltd touched a fresh 52-week peak of Rs 221.7 on 09 Jun 2026, marking a significant milestone in its price momentum. This breakout comes amid a sustained seven-day rally that has propelled the stock up by 25.53%, outpacing its sector by 2.9% on the day.
Read full news article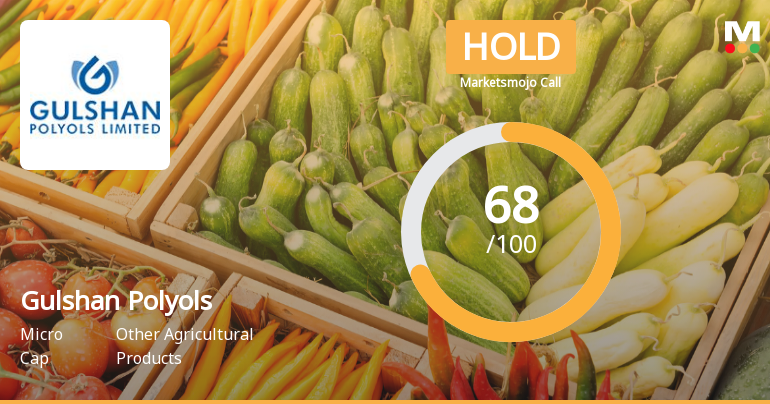
Gulshan Polyols Ltd Downgraded to Hold Amid Mixed Financial and Valuation Signals
Gulshan Polyols Ltd, a micro-cap player in the Other Agricultural Products sector, has seen its investment rating downgraded from Buy to Hold as of 8 June 2026. Despite strong recent quarterly financials and market-beating returns, concerns over valuation, debt servicing ability, and long-term growth prospects have tempered investor enthusiasm.
Read full news article Announcements
Intimation Regarding Media Interaction With NDTV Profit
09-Jun-2026 | Source : BSEIntimation regarding Media Interaction with NDTV profit
Announcement under Regulation 30 (LODR)-Analyst / Investor Meet - Intimation
30-May-2026 | Source : BSEThis is to inform you that the Investor/Analyst Call of the Company will be held on June 03 2026 and June 04 2026.
Compliances-Reg.24(A)-Annual Secretarial Compliance
27-May-2026 | Source : BSEEnclosed the Annual Secretarial Compliance Report for the period ended March 31 2026.
Corporate Actions

No Upcoming Board Meetings

Gulshan Polyols Ltd has declared 30% dividend, ex-date: 11 Sep 25

Gulshan Polyols Ltd has announced 1:5 stock split, ex-date: 27 Dec 16

Gulshan Polyols Ltd has announced 1:5 bonus issue, ex-date: 21 Jun 23

No Rights history available
Quality key factors
Valuation key factors
Technicals key factors
 Technical Indicator Scale: Bearish, Mildly Bearish, Sideways, Mildly Bullish, Bullish Turned
 Shareholding Snapshot : Mar 2026
Shareholding Compare (%holding)
Promoters
None
Held by 0 Schemes
Held by 3 FIIs (0.3%)
Gulshan Family Benefit Trust(chandra Kumar Jain) (20.94%)
None
25.31%
Quarterly Results Snapshot (Standalone) - Mar'26 - QoQ

QoQ Growth in quarter ended Mar 2026 is -12.10% vs 15.68% in Dec 2025
QoQ Growth in quarter ended Mar 2026 is -8.22% vs 163.36% in Dec 2025
Half Yearly Results Snapshot (Consolidated) - Sep'25
Growth in half year ended Sep 2025 is 26.81% vs 48.85% in Sep 2024

Growth in half year ended Sep 2025 is 164.80% vs 66.56% in Sep 2024
Nine Monthly Results Snapshot (Standalone) - Dec'25
YoY Growth in nine months ended Dec 2025 is 17.07% vs 54.75% in Dec 2024
YoY Growth in nine months ended Dec 2025 is 291.67% vs 57.54% in Dec 2024
Annual Results Snapshot (Standalone) - Mar'26
YoY Growth in year ended Mar 2026 is 14.49% vs 46.57% in Mar 2025
YoY Growth in year ended Mar 2026 is 332.23% vs 40.53% in Mar 2025
About Gulshan Polyols Ltd

Company Coordinates


