
Compare Hariom Pipe with Similar Stocks
Dashboard
Healthy long term growth as Net Sales has grown by an annual rate of 41.99% and Operating profit at 32.53%
The company declared positive results in Mar'26 after flat results in Dec'25
With ROCE of 14.1, it has a Very Attractive valuation with a 1.6 Enterprise value to Capital Employed
Stock DNA
Iron & Steel Products
INR 1,230 Cr (Micro Cap)
16.00
26
0.00%
0.58
11.71%
1.95
Total Returns (Price + Dividend) 
Latest dividend: 0.6 per share ex-dividend date: Sep-13-2024
Risk Adjusted Returns v/s
Returns Beta

News
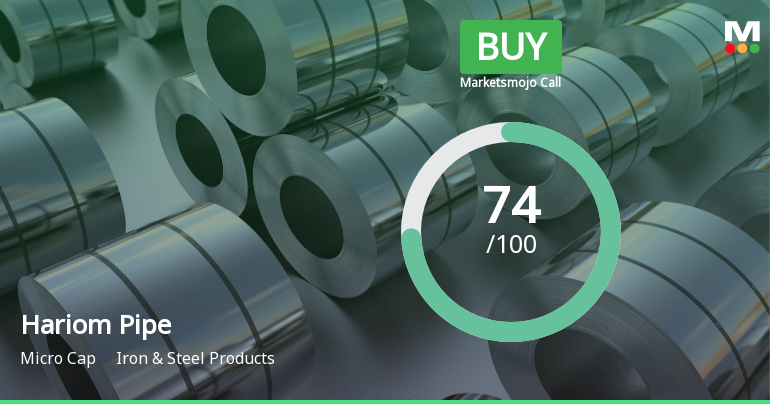
Hariom Pipe Industries Ltd Upgraded to Buy on Strong Technical and Financial Metrics
Hariom Pipe Industries Ltd has been upgraded from a Hold to a Buy rating following a comprehensive reassessment of its quality, valuation, financial trends, and technical indicators. The upgrade reflects improved technical momentum, robust quarterly financial results, attractive valuation metrics, and a positive long-term growth outlook despite some challenges in market performance.
Read full news article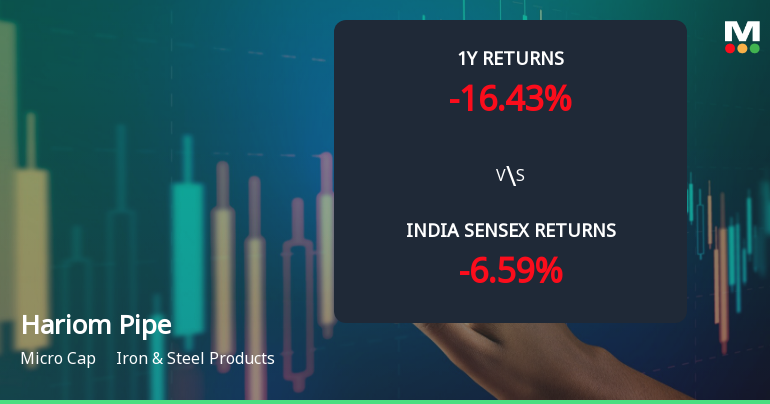
Hariom Pipe Industries Ltd Technical Momentum Shifts to Bullish Amid Mixed Signals
Hariom Pipe Industries Ltd, a micro-cap player in the Iron & Steel Products sector, has recently experienced a notable shift in its technical momentum, upgrading its MarketsMOJO grade from Hold to Buy with a Mojo Score of 74.0. Despite a modest day decline of 1.59%, the stock’s technical indicators reveal a complex but predominantly bullish outlook, signalling potential opportunities for investors willing to navigate its nuanced price action.
Read full news article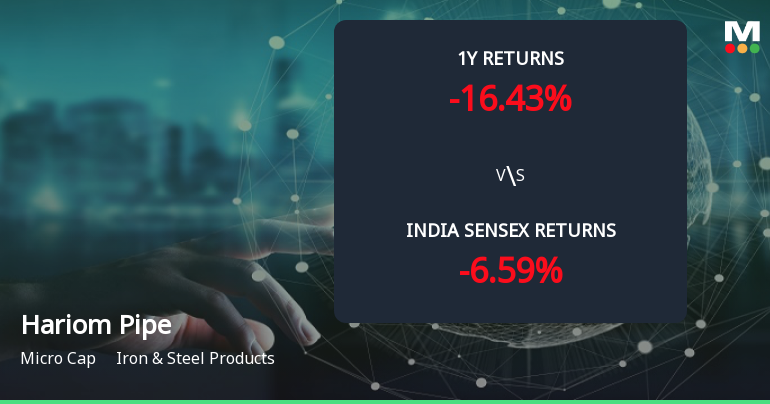
Golden Cross Forms in Hariom Pipe Industries Ltd — On a Day the Stock Fell 1.6%. What the Mixed Signals Mean
The 50-day moving average has crossed above the 200-day moving average for Hariom Pipe Industries Ltd on 16 Jul 2026, signalling a golden cross. Yet, the stock declined 1.59% on the same day, while monthly technical indicators remain mildly bearish. This juxtaposition of signals calls for a detailed examination of the cross’s reliability in the context of broader technical and fundamental data.
Read full news article Announcements
Corporate Actions

No Upcoming Board Meetings

Hariom Pipe Industries Ltd has declared 6% dividend, ex-date: 23 Sep 25

No Splits history available

No Bonus history available

No Rights history available
Quality key factors
Valuation key factors
Technicals key factors
 Technical Indicator Scale: Bearish, Mildly Bearish, Sideways, Mildly Bullish, Bullish Turned
 Shareholding Snapshot : Mar 2026
Shareholding Compare (%holding)
Promoters
None
Held by 0 Schemes
Held by 8 FIIs (9.49%)
Rupesh Kumar Gupta (14.45%)
Malabar India Fund Limited (9.42%)
27.72%
Quarterly Results Snapshot (Consolidated) - Mar'26 - QoQ

QoQ Growth in quarter ended Mar 2026 is 39.80% vs 8.03% in Dec 2025
QoQ Growth in quarter ended Mar 2026 is 159.71% vs 11.34% in Dec 2025
Half Yearly Results Snapshot (Standalone) - Sep'25

Growth in half year ended Sep 2025 is 21.20% vs 21.24% in Sep 2024
Growth in half year ended Sep 2025 is 2.32% vs 10.06% in Sep 2024
Nine Monthly Results Snapshot (Standalone) - Dec'25
YoY Growth in nine months ended Dec 2025 is 21.14% vs 16.43% in Dec 2024
YoY Growth in nine months ended Dec 2025 is 2.58% vs 11.14% in Dec 2024
Annual Results Snapshot (Consolidated) - Mar'26
YoY Growth in year ended Mar 2026 is 22.84% vs 17.68% in Mar 2025
YoY Growth in year ended Mar 2026 is 22.65% vs 8.68% in Mar 2025
About Hariom Pipe Industries Ltd

Company Coordinates


