
Compare Rama Steel Tubes with Similar Stocks
Dashboard
Weak Long Term Fundamental Strength with a -5.63% CAGR growth in Operating Profits over the last 5 years
- Low ability to service debt as the company has a high Debt to EBITDA ratio of 7.65 times
- The company has been able to generate a Return on Capital Employed (avg) of 9.19% signifying low profitability per unit of total capital (equity and debt)
With a fall in Net Sales of -16.05%, the company declared Very Negative results in Mar 26
Reducing Promoter Confidence
Below par performance in long term as well as near term
Stock DNA
Iron & Steel Products
INR 733 Cr (Micro Cap)
55.00
26
0.00%
0.26
2.76%
1.53
Total Returns (Price + Dividend) 
Latest dividend: 0.006600000000000001 per share ex-dividend date: Feb-24-2022
Risk Adjusted Returns v/s
Returns Beta

News
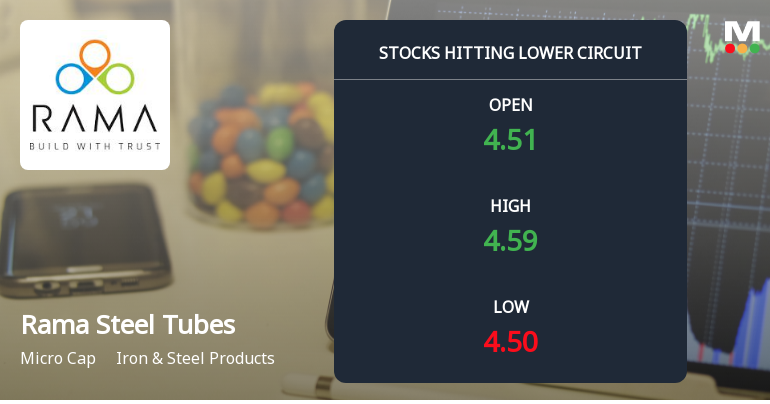
Rama Steel Tubes Ltd Locks at Lower Circuit With 5% Loss — Sellers Queue, No Buyers in Sight
At Rs 4.33, sellers were still queuing — but there were no buyers willing to take the other side. Rama Steel Tubes Ltd locked at its lower circuit of 5% on 10 Jul 2026, with unfilled sell orders and a frozen price.
Read full news article
Rama Steel Tubes Ltd is Rated Strong Sell
Rama Steel Tubes Ltd is rated Strong Sell by MarketsMOJO, with this rating last updated on 02 June 2026. However, the analysis and financial metrics discussed here reflect the company’s current position as of 08 July 2026, providing investors with the latest insights into its performance and outlook.
Read full news article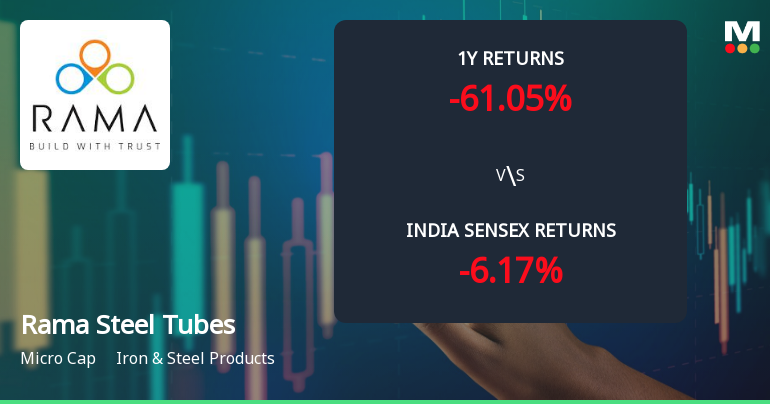
Rama Steel Tubes Ltd Technical Momentum Shifts Amid Prolonged Downtrend
Rama Steel Tubes Ltd, a micro-cap player in the Iron & Steel Products sector, has experienced a notable shift in its technical momentum, reflecting a complex interplay of bearish and mildly bullish signals. Despite a recent downgrade to a Strong Sell rating by MarketsMOJO, the stock’s technical indicators reveal nuanced trends that merit close attention from investors navigating its prolonged downtrend.
Read full news article Announcements
Rama Steel Tubes Limited - Updates
18-Nov-2019 | Source : NSERama Steel Tubes Limited has informed the Exchange regarding 'Newspaper publication of Unaudited Financial Results for the quarter and half year ended on September 30, 2019'.
Rama Steel Tubes Limited - Outcome of Board Meeting
14-Nov-2019 | Source : NSERama Steel Tubes Limited has informed the Exchange regarding Board meeting held on November 14, 2019.
Rama Steel Tubes Limited - Updates
23-Oct-2019 | Source : NSERama Steel Tubes Limited has informed the Exchange regarding 'Certificate under Regulation 74(5) of the SEBI (Depositories and Participants) Regulations, 2018 for the quarter ended September 30, 2019'.
Corporate Actions

No Upcoming Board Meetings

Rama Steel Tubes Ltd has declared 10% dividend, ex-date: 24 Feb 22

Rama Steel Tubes Ltd has announced 1:5 stock split, ex-date: 25 Aug 22

Rama Steel Tubes Ltd has announced 2:1 bonus issue, ex-date: 19 Mar 24

No Rights history available
Quality key factors
Valuation key factors
Technicals key factors
 Technical Indicator Scale: Bearish, Mildly Bearish, Sideways, Mildly Bullish, Bullish Turned
 Shareholding Snapshot : Jun 2026
Shareholding Compare (%holding)
Non Institution
None
Held by 0 Schemes
Held by 14 FIIs (2.7%)
Naresh Kumar Bansal (17.1%)
Ebisu Global Opportunities Fund Limited (2.44%)
57.09%
Quarterly Results Snapshot (Consolidated) - Mar'26 - YoY

YoY Growth in quarter ended Mar 2026 is -16.05% vs 9.29% in Mar 2025
YoY Growth in quarter ended Mar 2026 is -37.43% vs -4.07% in Mar 2025
Half Yearly Results Snapshot (Consolidated) - Sep'25

Growth in half year ended Sep 2025 is 22.70% vs -7.01% in Sep 2024
Growth in half year ended Sep 2025 is -34.87% vs -23.68% in Sep 2024
Nine Monthly Results Snapshot (Consolidated) - Dec'25
YoY Growth in nine months ended Dec 2025 is 16.31% vs -3.01% in Dec 2024
YoY Growth in nine months ended Dec 2025 is -43.75% vs -30.25% in Dec 2024
Annual Results Snapshot (Consolidated) - Mar'26
YoY Growth in year ended Mar 2026 is 7.26% vs 0.15% in Mar 2025
YoY Growth in year ended Mar 2026 is -44.73% vs -21.87% in Mar 2025
About Rama Steel Tubes Ltd

Company Coordinates


