
Compare Haz.Multi Proj. with Similar Stocks
Total Returns (Price + Dividend) 
Latest dividend: 0.20000000000000004 per share ex-dividend date: Sep-22-2025
Risk Adjusted Returns v/s
Returns Beta

News

Markets Rally, But Hazoor Multi Projects Ltd Sinks to 52-Week Low in Stock-Specific Sell-Off
Despite broader market resilience, Hazoor Multi Projects Ltd has plunged to a fresh 52-week low of Rs 22.33 on 23 Jul 2026, marking a 47.17% decline over the past year and underscoring a stark divergence from the Sensex’s relatively modest 7.61% fall.
Read full news article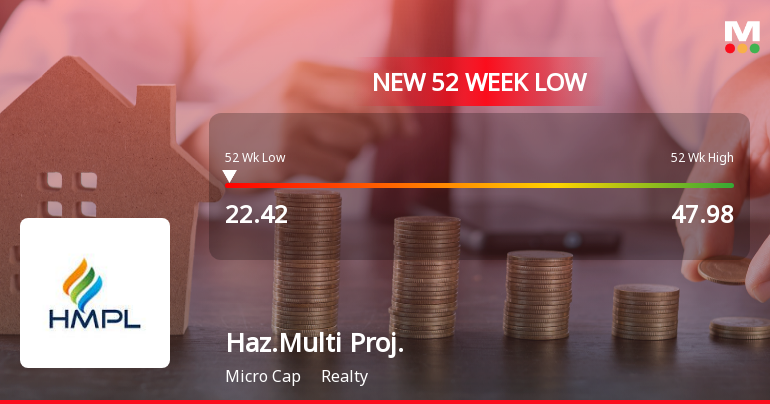
Markets Rally, But Hazoor Multi Projects Ltd Sinks to 52-Week Low in Stock-Specific Sell-Off
Despite a broadly positive market environment, Hazoor Multi Projects Ltd has slipped to a fresh 52-week low of Rs 22.42 on 22 Jul 2026, extending its recent downward momentum amid sectoral pressures and company-specific concerns.
Read full news article
Hazoor Multi Projects Ltd is Rated Sell
Hazoor Multi Projects Ltd is rated Sell by MarketsMOJO, with this rating last updated on 03 June 2026. However, the analysis and financial metrics presented here reflect the company’s current position as of 18 July 2026, providing investors with the latest insights into the stock’s performance and outlook.
Read full news article Announcements
List Of Key Managerial Personnel (KMP) To Determine The Materiality Of An Event Or Information And To Make Disclosures To Stack Exchange.
14-Jul-2026 | Source : BSEList of Key Manageial Personnel (KMP) to Determine the Materiality of an Event or Information and to make Disclosures to Stock Exchange.
Announcement under Regulation 30 (LODR)-Resignation of Company Secretary / Compliance Officer
14-Jul-2026 | Source : BSEResignation of Mrs. Anushree Tekriwal from the post of Company Secretary and Compliance Officer of the Company.
Compliances-Certificate under Reg. 74 (5) of SEBI (DP) Regulations 2018
08-Jul-2026 | Source : BSEPlease find attached certificate under Regulation 74(5) of Securities and Exchange Board of India ( Depository Participants) Regulations 2018 for the quarter ended 30th June 2026.
Corporate Actions

No Upcoming Board Meetings

Hazoor Multi Projects Ltd has declared 20% dividend, ex-date: 22 Sep 25

Hazoor Multi Projects Ltd has announced 1:10 stock split, ex-date: 07 Nov 24

Hazoor Multi Projects Ltd has announced 1:1 bonus issue, ex-date: 28 Dec 06

Hazoor Multi Projects Ltd has announced 1:2 rights issue, ex-date: 20 Jan 23
Quality key factors
Valuation key factors
Technicals key factors
 Technical Indicator Scale: Bearish, Mildly Bearish, Sideways, Mildly Bullish, Bullish Turned
 Shareholding Snapshot : Jun 2026
Shareholding Compare (%holding)
Non Institution
None
Held by 0 Schemes
Held by 28 FIIs (26.44%)
Keemtee Financial Services Limited (10.52%)
West Midlands Cars Private Limited (4.48%)
34.56%
Quarterly Results Snapshot (Consolidated) - Mar'26 - QoQ

QoQ Growth in quarter ended Mar 2026 is 13.93% vs 36.17% in Dec 2025

QoQ Growth in quarter ended Mar 2026 is 401.24% vs 165.06% in Dec 2025
Half Yearly Results Snapshot (Standalone) - Sep'25
Growth in half year ended Sep 2025 is 65.61% vs -59.72% in Sep 2024
Growth in half year ended Sep 2025 is 105.72% vs -86.17% in Sep 2024
Nine Monthly Results Snapshot (Standalone) - Dec'25
YoY Growth in nine months ended Dec 2025 is 54.84% vs -52.88% in Dec 2024
YoY Growth in nine months ended Dec 2025 is 58.14% vs -82.31% in Dec 2024
Annual Results Snapshot (Consolidated) - Mar'26
YoY Growth in year ended Mar 2026 is -9.11% vs 17.10% in Mar 2025
YoY Growth in year ended Mar 2026 is 6.78% vs -37.31% in Mar 2025
About Hazoor Multi Projects Ltd

Company Coordinates


