
Compare HFCL with Similar Stocks
Stock DNA
Telecom - Equipment & Accessories
INR 26,020 Cr (Small Cap)
83.00
21
0.06%
0.25
6.37%
5.30
Total Returns (Price + Dividend) 
Latest dividend: 0.1 per share ex-dividend date: Sep-08-2025
Risk Adjusted Returns v/s
Returns Beta

News
HFCL Ltd Sees Exceptional Volume Amid Price Pressure Despite Buy Rating Upgrade
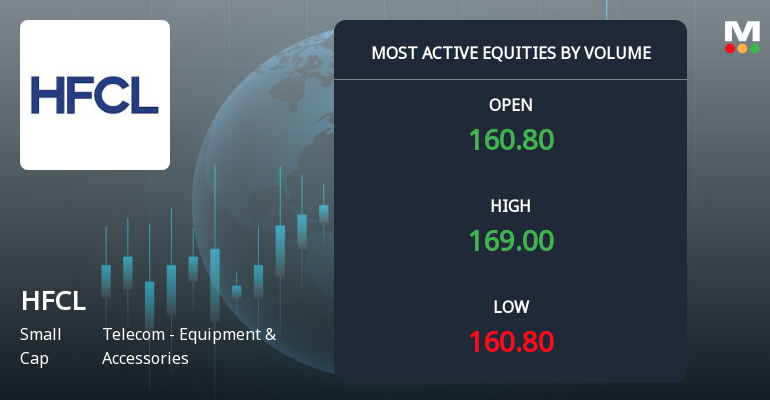
HFCL Ltd, a small-cap player in the Telecom - Equipment & Accessories sector, witnessed one of the highest trading volumes on 11 Jun 2026, with over 2.4 crore shares exchanging hands. Despite this surge in activity, the stock underperformed its sector and broader market indices, reflecting a complex interplay of investor sentiment and technical signals.
Read full news article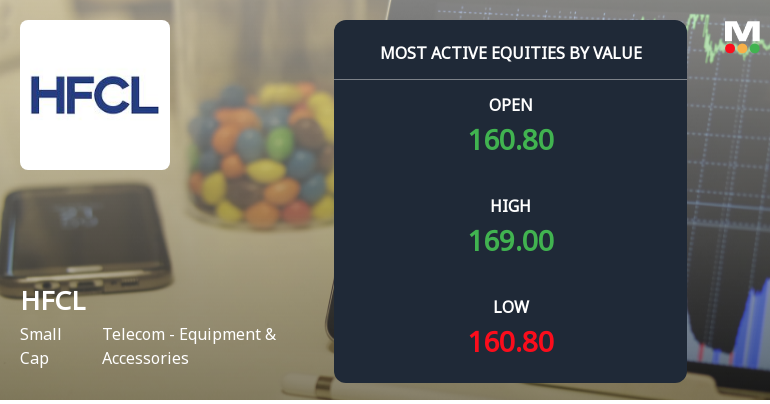
HFCL Ltd Sees High-Value Trading Amid Volatility; Mojo Grade Upgraded to Buy
HFCL Ltd, a prominent player in the Telecom - Equipment & Accessories sector, witnessed significant trading activity on 11 June 2026, emerging as one of the most actively traded stocks by value. Despite a notable intraday decline, institutional interest and large order flows continue to shape the stock’s dynamic, reflecting a complex interplay of market forces and investor sentiment.
Read full news article
Below All Moving Averages and Now at Lower Circuit: HFCL Ltd Loses 5.0% in a Single Session
At Rs 160.66, sellers were still queuing — but no buyers stepped forward. HFCL Ltd locked at its lower circuit of 5.0% on 11 Jun 2026, with unfilled sell orders and a frozen price, signalling a day dominated by supply overwhelming demand.
Read full news article Announcements
Announcement under Regulation 30 (LODR)-Analyst / Investor Meet - Intimation
08-Jun-2026 | Source : BSEThe Company will be participating in the Defence Conference hosted by DAM Capital on Thursday June 11 2026 at Hyderabad to discuss about the general business updates and the industry in which the Company operates with investors on group/one-on-one interactions.
Announcement under Regulation 30 (LODR)-Analyst / Investor Meet - Intimation
08-Jun-2026 | Source : BSEThe management of the Company will be hosting a plant visit for institutional investors on Friday June 12 2026 at the Companys manufacturing facilities located in Hyderabad.
Board Meeting Outcome for Outcome Of The Meeting Of The Board Of Directors Of The Company Held On June 03 2026
03-Jun-2026 | Source : BSEOutcome of the Meeting of the Board of Directors of the Company held on June 03 2026 as per attached letter.
Corporate Actions

No Upcoming Board Meetings

HFCL Ltd has declared 10% dividend, ex-date: 08 Sep 25

No Splits history available

No Bonus history available

No Rights history available
Quality key factors
Valuation key factors
Technicals key factors
 Technical Indicator Scale: Bearish, Mildly Bearish, Sideways, Mildly Bullish, Bullish Turned
 Shareholding Snapshot : Mar 2026
Shareholding Compare (%holding)
Non Institution
56.9338
Held by 24 Schemes (6.92%)
Held by 140 FIIs (7.08%)
Mn Ventures Private Limited (13.92%)
Quant Mutual Fund - Quant Multi Cap Fund (6.54%)
37.37%
Quarterly Results Snapshot (Consolidated) - Mar'26 - YoY

YoY Growth in quarter ended Mar 2026 is 127.81% vs -39.62% in Mar 2025
YoY Growth in quarter ended Mar 2026 is 319.21% vs -173.99% in Mar 2025
Half Yearly Results Snapshot (Consolidated) - Sep'25

Growth in half year ended Sep 2025 is -14.99% vs 6.89% in Sep 2024
Growth in half year ended Sep 2025 is -80.77% vs 34.67% in Sep 2024
Nine Monthly Results Snapshot (Consolidated) - Dec'25
YoY Growth in nine months ended Dec 2025 is -4.25% vs 3.98% in Dec 2024
YoY Growth in nine months ended Dec 2025 is -48.53% vs 17.79% in Dec 2024
Annual Results Snapshot (Consolidated) - Mar'26
YoY Growth in year ended Mar 2026 is 21.77% vs -8.97% in Mar 2025
YoY Growth in year ended Mar 2026 is 75.72% vs -46.21% in Mar 2025
About HFCL Ltd

Company Coordinates


