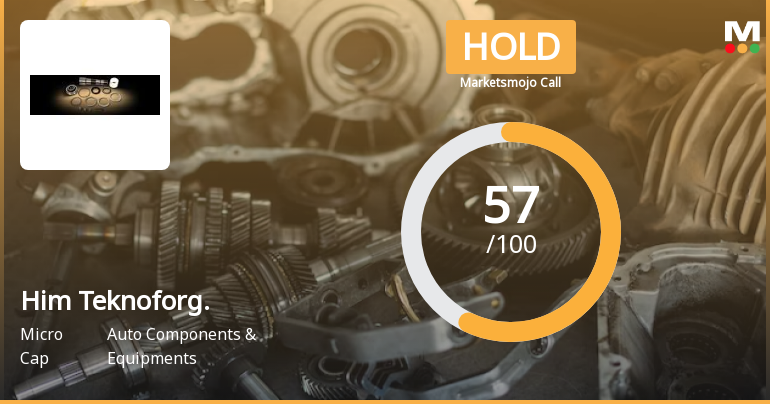
Him Teknoforg.

  • Market Cap: Micro Cap
  • Industry: Auto Components & Equipments
  • ISIN: INE705G01021
  • NSEID:
  • BSEID: 505712
INR
275.00
4.2 (1.55%)
BSENSE

Sep 01, 03:30 PM

BSE+NSE Vol: 40.05 k

  • Price Points
  • Score
  • Mojo Parameters
  • Total Return
  • News and Corporate Actions
  • Key factors
  • Shareholding
  • Financials
  • CompanyCV
stock-summaryPrice Point
High/Low

1Day

52 Week

Valuation
Technical
Day's Volume

CASH

40.05 k (26.50%) Volume

Shareholding (Jun 2026)

FII

0.27%

Held by 2 FIIs

DII

0.01%

Held by 0 DIIs

Promoter

54.37%

Why is Him Teknoforge Ltd falling/rising?

02-Sep-2026

As of 01-Sep, Him Teknoforge Ltd's stock price is rising to 275.00, with a notable year-to-date growth of 25.97% and a 33.98% return over the past year, significantly outperforming the Sensex. Despite a drop in investor participation, the stock's strong performance metrics and positive financial results support its upward trend.

As of 01-Sep, Him Teknoforge Ltd's stock price is rising, currently at 275.00, reflecting a change of 4.2 (1.55%) upwards. The stock has shown strong performance over various periods, with a notable increase of 5.91% over the past week, while the Sensex has declined by 0.92%. Additionally, the stock has gained 2.59% in the last month, contrasting with a 1.47% drop in the Sensex during the same timeframe.<BR><BR>The stock has also demonstrated impressive year-to-date growth of 25.97%, significantly outperforming the Sensex, which has decreased by 9.71%. Over the past year, Him Teknoforge Ltd has achieved a return of 33.98%, while the Sensex has fallen by 4.26%. This trend continues in the longer term, with a remarkable 115.69% increase over three years compared to the Sensex's 17.67%.<BR><BR>Today's performance indicates that the stock has outperformed its sector by 1.84% and has been on a consecutive gain streak for the last three days, accumulating a total return of 5.18% in this period. The stock reached an intraday high of Rs 280.45, marking a 3.56% increase. Furthermore, it is trading above its 5-day, 20-day, 50-day, 100-day, and 200-day moving averages, which is a positive indicator of its price momentum.<BR><BR>Despite a decline in investor participation, with delivery volume dropping by 52.26% against the 5-day average, the stock remains liquid enough for trading. The company has reported positive financial results, including the highest quarterly profit after tax of Rs 4.15 crore and a significant increase in operating profit to net sales ratio. With a favorable valuation and a PEG ratio of 0.9, the stock is seen as trading at a discount compared to its peers, further supporting its rising price. Overall, the combination of strong performance metrics, positive financial results, and favorable market conditions contributes to the upward movement of Him Teknoforge Ltd's stock price.

View full answer

Who are in the management team of Him Teknoforg.?

01-Sep-2026

The management team of Him Teknoforg includes Vijay Aggarwal (Chairman & Managing Director), Rajiv Aggarwal (Joint Managing Director), and several independent directors: P L Sharma, Pradeep Kumar, Kuldip Narain Gupta, and Kiran Raghuvinder Singh, along with nominees Bhavna Rao and Sanjay Kumar. This diverse team contributes to the company's strategic direction and governance.

The management team of Him Teknoforg includes the following individuals:<BR><BR>1. **Vijay Aggarwal** - Chairman & Managing Director<BR>2. **Rajiv Aggarwal** - Joint Managing Director<BR>3. **P L Sharma** - Independent Director<BR>4. **Pradeep Kumar** - Independent Director<BR>5. **Bhavna Rao** - Nominee<BR>6. **Sanjay Kumar** - Nominee<BR>7. **Kuldip Narain Gupta** - Independent Director<BR>8. **Kiran Raghuvinder Singh** - Independent Director<BR><BR>This team brings a diverse range of expertise to the company, contributing to its strategic direction and governance.

View full answer

What does Him Teknoforg. do?

01-Sep-2026

Him Teknoforge Ltd is a micro-cap manufacturer of forgings and machined components for the auto industry, with a market cap of INR 279 Cr and reported net sales of 118 Cr and net profit of 4 Cr for June 2026. The company has a P/E ratio of 20.00 and a debt-equity ratio of 0.69.

Overview:<BR>Him Teknoforge Ltd is a leading manufacturer and supplier of a wide variety of quality forgings and machined components in the auto components and equipment industry, categorized as a micro-cap company.<BR><BR>History:<BR>Him Teknoforge Ltd, formerly known as Gujarat Automotive Gears Ltd, was established in March 1991. The latest quarterly results reported are for June 2026, showing net sales and profit figures.<BR><BR>Financial Snapshot:<BR>Net Sales: 118 Cr (Quarterly Results - Jun 2026) <BR>Net Profit: 4 Cr (Quarterly Results - Jun 2026) <BR>Market cap: INR 279 Cr (Micro Cap)<BR><BR>Key Metrics:<BR>P/E: 20.00 <BR>Industry P/E: 41 <BR>Dividend Yield: 0.00% <BR>Debt Equity: 0.69 <BR>Return on Equity: 6.15% <BR>Price to Book: 1.22 <BR><BR>Contact Details:<BR>Address: Village Billanwadi, Baddi Solan Himachal Pradesh : 173205 <BR>Tel: 91-1795-246351/245466 <BR>Email: gujarat.gears@gagl.net/gujarat.gear <BR>Website: http://www.himteknoforge.com

View full answer

Who are the peers of the Him Teknoforg.?

01-Sep-2026

Him Teknoforg.'s peers include Jay Ushin, Remsons Ind., Talbros Engg., Sundaram Brake, Pritika Auto, Pavna Industries, Setco Automotive, Bimetal Bearings, SKP Bearing, and AVATAR Industrie. Talbros Engg. has the best management and growth ratings, while Him Teknoforg. has a Below Average management risk and a 1-year return of 34.73%.

Peers: The peers of Him Teknoforg. are Jay Ushin, Remsons Ind., Talbros Engg., Sundaram Brake, Pritika Auto, Pavna Industries, Setco Automotive, Bimetal Bearings, SKP Bearing, and AVATAR Industrie.<BR><BR>Quality Snapshot: Excellent management risk is observed at Talbros Engg. and Setco Automotive, while Average management risk is found at Jay Ushin, Remsons Ind., Bimetal Bearings, SKP Bearing, and the rest. Below Average management risk is noted for Him Teknoforg., Sundaram Brake, Pritika Auto, Pavna Industries, and AVATAR Industrie. Growth ratings show that only Talbros Engg. has a Good rating, while the rest, including Jay Ushin, Remsons Ind., Sundaram Brake, Pritika Auto, Him Teknoforg., Pavna Industries, Setco Automotive, Bimetal Bearings, SKP Bearing, and AVATAR Industrie, are rated Below Average. In terms of Capital Structure, Bimetal Bearings stands out with an Excellent rating, while Average ratings are assigned to Remsons Ind., Talbros Engg., and the rest, with Below Average ratings for Him Teknoforg., Sundaram Brake, Pritika Auto, Pavna Industries, Setco Automotive, SKP Bearing, and AVATAR Industrie.<BR><BR>Return Snapshot: The peer with the highest 1-year return is Talbros Engg. at 11.11%, while Pavna Industries has the lowest at -57.07%. Him Teknoforg.'s 1-year return is 34.73%, which is significantly higher than both extremes. Additionally, the six-month return is negative for Remsons Ind., Pavna Industries, and Setco Automotive.

View full answer

How big is Him Teknoforg.?

01-Sep-2026

As of 31st August, Him Teknoforge Ltd has a market capitalization of 279.00 Cr, with recent net sales of 272.42 Cr and a net profit of 4.00 Cr. Shareholder's funds are 220.40 Cr, and total assets are valued at 453.25 Cr as of March 2025.

As of 31st August, Him Teknoforge Ltd has a market capitalization of 279.00 Cr, categorizing it as a Micro Cap company.<BR><BR>In the latest four quarters, the company reported Net Sales totaling 272.42 Cr. The Net Profit for the same period was 4.00 Cr.<BR><BR>The latest annual period for the balance sheet is March 2025, with Shareholder's Funds amounting to 220.40 Cr and Total Assets valued at 453.25 Cr.

View full answer

Which are the latest news on Him Teknoforg.?

01-Sep-2026

Should I buy, sell or hold Him Teknoforge Ltd?

14-Aug-2026

When is the next results date for Him Teknoforge Ltd?

07-Aug-2026

The next results date for Him Teknoforge Ltd is 12 August 2026.

The next results date for Him Teknoforge Ltd is scheduled for 12 August 2026.

View full answer

Are Him Teknoforge Ltd latest results good or bad?

31-Jan-2026

Him Teknoforge Ltd's latest results are concerning, showing a 36.02% decline in net profit and a 15.21% drop in net sales, despite an improvement in operating margin to 10.62%. The high tax rate and operational challenges further complicate the outlook, suggesting caution for investors.

Him Teknoforge Ltd's latest results present a mixed picture. On one hand, the company achieved an operating margin expansion to 10.62%, which is a positive sign of improved operational efficiency compared to the previous quarter's 8.87%. However, this positive aspect is overshadowed by a significant decline in net profit, which fell by 36.02% quarter-on-quarter to ₹1.35 crores. Additionally, net sales contracted by 15.21% to ₹87.93 crores, raising concerns about demand stability in their core automotive forgings segment.<BR><BR>The elevated tax rate of 49.44% in Q3 FY26, a sharp increase from the previous quarter, has also negatively impacted profitability, effectively halving the profit after tax. This unusual tax burden raises questions about earnings quality and predictability.<BR><BR>Overall, while the margin improvement is encouraging, the substantial drop in net profit and sales, coupled with high leverage and operational challenges, suggest that the company's latest results are more concerning than positive. Investors may need to be cautious given the current financial momentum and structural issues facing the company.

View full answer

Is Him Teknoforg. overvalued or undervalued?

17-Nov-2025

As of November 14, 2025, Him Teknoforg. is fairly valued with a PE ratio of 21.09 and an attractive valuation grade, outperforming the Sensex with a year-to-date return of 10.95%, and is considered undervalued compared to peers like Samvardh. Mothe. and Uno Minda.

As of 14 November 2025, the valuation grade for Him Teknoforg. has moved from very attractive to attractive. The company is currently fairly valued based on its financial metrics. Key ratios include a PE ratio of 21.09, an EV to EBITDA of 9.27, and a ROCE of 7.68%. <BR><BR>In comparison to peers, Him Teknoforg. has a PE ratio that is significantly lower than Samvardh. Mothe. at 34.21 and Uno Minda at 68.99, indicating it may be undervalued relative to these competitors. Additionally, the company's recent stock performance has outpaced the Sensex, with a year-to-date return of 10.95% compared to the Sensex's 8.22%, reinforcing a positive outlook on its valuation.

View full answer

How has been the historical performance of Him Teknoforg.?

12-Nov-2025

Him Teknoforg reported a net profit of 7.21 crore and total operating income of 373.43 crore for the year ending March 2024, with total assets increasing to 453.25 crore by March 2025. Despite fluctuations in cash flow, the company has shown steady growth in revenue and assets.

Answer:<BR>The historical performance of Him Teknoforg shows a consolidated net profit of 7.21 crore for the year ending March 2024, with total operating income recorded at 373.43 crore. The company faced a total expenditure of 339.00 crore, leading to an operating profit (PBDIT) of 36.92 crore. The profit before tax stood at 9.80 crore, resulting in a profit after tax of 7.21 crore. The earnings per share (EPS) for the same period was 9.18. The operating profit margin was 9.22%, while the profit after tax margin was 1.93%. <BR><BR>In terms of balance sheet performance, total assets increased to 453.25 crore in March 2025 from 413.63 crore in March 2024. Shareholder's funds also rose to 220.40 crore, with long-term borrowings decreasing to 54.65 crore. Current assets amounted to 254.24 crore, reflecting a growth from 227.26 crore the previous year. Cash flow from operating activities was 4.00 crore, while cash flow from investing activities showed a negative figure of -22.00 crore. Overall, the company has demonstrated a steady growth in both revenue and assets, despite fluctuations in cash flow from operations. <BR><BR>Breakdown:<BR>Him Teknoforg's consolidated financial results for March 2024 indicate a net profit of 7.21 crore, supported by total operating income of 373.43 crore and total expenditure of 339.00 crore, leading to an operating profit of 36.92 crore. The profit before tax was reported at 9.80 crore, with a corresponding profit after tax of 7.21 crore, resulting in an EPS of 9.18. The operating profit margin was 9.22%, while the profit after tax margin was 1.93%. On the balance sheet side, total assets increased to 453.25 crore in March 2025, with shareholder's funds rising to 220.40 crore and long-term borrowings decreasing to 54.65 crore. Current assets also grew to 254.24 crore, reflecting a positive trend, although cash flow from operating activities was lower at 4.00 crore, contrasted by a negative cash flow from investing activities of -22.00 crore. Overall, the company has shown resilience and growth in key financial metrics over the years.

View full answer

What is the technical trend for Him Teknoforg.?

09-Jun-2025

As of June 4, 2025, the market trend is mildly bearish, indicated by daily moving averages, while mixed signals from weekly and monthly indicators suggest a complex outlook.

As of 4 June 2025, the technical trend has changed from sideways to mildly bearish. The current stance is mildly bearish, driven by the daily moving averages indicating a bearish trend. The weekly MACD is mildly bullish, but the monthly MACD is mildly bearish, suggesting mixed signals across time frames. The Bollinger Bands are bullish on both weekly and monthly charts, which contrasts with the overall bearish sentiment. The KST shows a similar pattern with a mildly bullish weekly and mildly bearish monthly reading. Dow Theory indicates a mildly bearish stance on the weekly chart, while the monthly shows no trend. Overall, the strength of the bearish trend is supported by the daily moving averages and the mixed signals from other indicators.

View full answer

Who are the top shareholders of the Him Teknoforg.?

06-Jun-2025

The top shareholders of Him Teknoforg include Rajiv Aggarwal, who holds 10.46%, and individual investors with a combined 40.68%. Additionally, Krish Automotive Sales And Services Private Limited is the largest public shareholder at 2.89%, while institutional investors hold minimal stakes.

The top shareholders of Him Teknoforg include the promoters, who hold a significant majority of the shares. The promoter with the highest holding is Rajiv Aggarwal, owning 10.46% of the company. Additionally, individual investors collectively hold 40.68% of the shares. On the institutional side, there is one Foreign Institutional Investor (FII) that holds 0.2% of the shares, while mutual funds currently do not hold any shares in the company. The highest public shareholder is Krish Automotive Sales And Services Private Limited, which holds 2.89%.

View full answer

Has Him Teknoforg. declared dividend?

06-Jun-2025

Him Teknoforge Ltd has declared a 20% dividend, amounting to 0.4 per share, with an ex-date of September 23, 2024. While the last 6 months showed a total return of -19.18%, the company has demonstrated significant growth over the longer term, particularly a total return of 444.99% over the past 5 years.

Him Teknoforge Ltd has declared a 20% dividend.<BR><BR>Dividend Details:<BR>- Percentage announced: 20%<BR>- Amount per share: 0.4<BR>- Ex-date: 23 Sep 24<BR><BR>Dividend Yield: 0.19%.<BR><BR>Total Returns by Period:<BR>In the last 6 months, the price return was -19.18%, with a dividend return of 0%, resulting in a total return of -19.18%.<BR><BR>Over the past year, the price return was 41.56%, the dividend return was 0.29%, leading to a total return of 41.85%.<BR><BR>In the 2-year period, the price return was 57.7%, the dividend return was 0.67%, culminating in a total return of 58.37%.<BR><BR>For the 3-year period, the price return was 105.27%, with a dividend return of 1.63%, resulting in a total return of 106.9%.<BR><BR>In the last 4 years, the price return was 96.59%, the dividend return was 1.45%, yielding a total return of 98.04%.<BR><BR>Over the past 5 years, the price return was 440.48%, with a dividend return of 4.51%, leading to a total return of 444.99%.<BR><BR>Overall, Him Teknoforge Ltd has declared a dividend, and while the recent performance shows a negative return over the last 6 months, the longer-term returns indicate significant growth, particularly over the 5-year period.

View full answer
iScoreScore
Click here to find our call on this stock
Strong Sell
Sell
Hold
Buy
Strong Buy

Dashboard

1

Weak Long Term Fundamental Strength with an average Return on Capital Employed (ROCE) of 7.94%

  • Poor long term growth as Net Sales has grown by an annual rate of 8.81% and Operating profit at 7.11% over the last 5 years
  • Low ability to service debt as the company has a high Debt to EBITDA ratio of 3.99 times
2

Positive results in Jun 26

3

With ROCE of 7.6, it has a Attractive valuation with a 1.2 Enterprise value to Capital Employed

4

43.66% of Promoter Shares are Pledged

5

Market Beating performance in long term as well as near term

stock-summaryMojo Parameters

Mojo Parameters

Loading Valuation Snapshot...

Stock DNA

stock-summary
Industry

Auto Components & Equipments

stock-summary
Market cap

INR 284 Cr (Micro Cap)

stock-summary
P/E

20.00

stock-summary
Industry P/E

41

stock-summary
Dividend Yield

0.00%

stock-summary
Debt Equity

0.69

stock-summary
Return on Equity

6.15%

stock-summary
Price to Book

1.24

Revenue and Profits:
Net Sales:
118 Cr
(Quarterly Results - Jun 2026)
Net Profit:
4 Cr
stock-summaryTotal Returns
Total Returns (Price + Dividend) stock-summary
Dividend Yield (0%)
TimePeriod
Price Return
Dividend Return
Total Return
3 Months
30.98%
0%
30.98%
6 Months
36.82%
0%
36.82%
1 Year
33.98%
0%
33.98%
2 Years
21.87%
0.16%
22.03%
3 Years
115.69%
0.73%
116.42%
4 Years
205.9%
0.86%
206.76%
5 Years
144.44%
1.09%
145.53%

Latest dividend: 0.4 per share ex-dividend date: Sep-23-2024

Risk Adjusted Returns v/s stock-summary
Returns Beta
Icon
Beta has not been calculated since enough price history is not available
stock-summaryNews & Corporate Actions

News

Announcements stock-summary

Closure of Trading Window

31-Aug-2026 | Source : BSE

We attach herewith intimation regarding closure of trading window.

Board Meeting Intimation for Recommendation Of Dividend

31-Aug-2026 | Source : BSE

Him Teknoforge Ltdhas informed BSE that the meeting of the Board of Directors of the Company is scheduled on 04/09/2026 inter alia to consider and approve We wish to inform you that Pursuant to Regulation 29 of Securities and Exchange Board of India (Listing Obligations and Disclosure Requirements) Regulations 2015 (Listing Regulations) a Meeting of the Board of Directors of the Company is scheduled to be held on Friday 04th day of September 2026 to consider and recommend dividend for financial year 2025-26.

Announcement under Regulation 30 (LODR)-Press Release / Media Release

13-Aug-2026 | Source : BSE

We attach herewith press Release of Financial results for Q1 FY 27

Corporate Actions stock-summary

stock-summary
BOARD MEETING

No Upcoming Board Meetings

stock-summary
DIVIDEND

Him Teknoforge Ltd has declared 25% dividend, ex-date: 20 Aug 25

stock-summary
SPLITS

Him Teknoforge Ltd has announced 2:10 stock split, ex-date: 03 Mar 14

stock-summary
BONUS

No Bonus history available

stock-summary
RIGHTS

No Rights history available

stock-summaryKey Factors

Quality key factors stock-summary

Factor
Value
Sales Growth (5y)
8.81%
EBIT Growth (5y)
7.11%
EBIT to Interest (avg)
1.56
Debt to EBITDA (avg)
4.29
Net Debt to Equity (avg)
0.69
Sales to Capital Employed (avg)
1.11
Tax Ratio
27.73%
Dividend Payout Ratio
4.85%
Pledged Shares
43.66%
Institutional Holding
0.28%
ROCE (avg)
7.68%
ROE (avg)
5.43%

Valuation key factors

Factor
Value
P/E Ratio
20
Industry P/E
41
Price to Book Value
1.26
EV to EBIT
12.06
EV to EBITDA
9.29
EV to Capital Employed
1.15
EV to Sales
0.97
PEG Ratio
0.94
Dividend Yield
NA
ROCE (Latest)
7.57%
ROE (Latest)
6.15%

Technicals key factors

Indicator
Weekly
Monthly
MACD
Bullish
Bullish
RSI
Bearish
No Signal
Bollinger Bands
Bullish
Bullish
Moving Averages
Bullish (Daily)
KST
Bullish
Mildly Bearish
Dow Theory
Mildly Bearish
No Trend
stock-summary Technical Indicator Scale: Bearish, Mildly Bearish, Sideways, Mildly Bullish, Bullish  Turned 
stock-summaryShareholding
Shareholding Snapshot : Jun 2026stock-summary
Shareholding Compare (%holding) stock-summary
Majority shareholders

Promoters

Pledged Promoter Holdings

43.656

Mutual Funds

Held by 0 Schemes

FIIs

Held by 2 FIIs (0.27%)

Promoter with highest holding

Rajiv Aggarwal (9.59%)

Highest Public shareholder

Krish Automotive Sales And Services Private Limited (2.65%)

Individual Investors Holdings

34.35%

stock-summaryFinancial
[
  {
    "link": "quarterly",
    "btn_text": "All Quarterly Results",
    "header": "Quarterly Results Snapshot (Standalone) - Jun'26 - QoQ",
    "rhs": [
      {
        "prefix": "Net Sales ",
        "suffix": "QoQ Growth in quarter ended Jun 2026 is -1.05% vs 10.09% in Mar 2026",
        "dir": -1
      },
      {
        "prefix": "Standalone Net Profit ",
        "suffix": "QoQ Growth in quarter ended Jun 2026 is 9.50% vs 24.67% in Mar 2026",
        "dir": -1
      }
    ],
    "table": {
      "header": [
        "Jun'26",
        "Mar'26",
        "Change(%)"
      ],
      "body": [
        {
          "field": "Net Sales",
          "val1": "118.28",
          "val2": "119.54",
          "chgp": "-1.05%",
          "chgp_class": "negative"
        },
        {
          "field": "Operating Profit (PBDIT) excl Other Income",
          "val1": "13.37",
          "val2": "11.58",
          "chgp": "15.46%",
          "chgp_class": "positive"
        },
        {
          "field": "Interest",
          "val1": "5.57",
          "val2": "5.02",
          "chgp": "10.96%",
          "chgp_class": "negative"
        },
        {
          "field": "Exceptional Items",
          "val1": "0.00",
          "val2": "0.00",
          "chgp": "",
          "chgp_class": "neutral"
        },
        {
          "field": "Standalone Net Profit",
          "val1": "4.15",
          "val2": "3.79",
          "chgp": "9.50%",
          "chgp_class": "positive"
        },
        {
          "field": "Operating Profit Margin (Excl OI)",
          "val1": "11.30%",
          "val2": "9.69%",
          "chgp": "1.61%",
          "chgp_class": "positive"
        }
      ]
    }
  },
  {
    "link": "half-yearly",
    "btn_text": "All Half Yearly Results",
    "header": "Half Yearly Results Snapshot (Standalone) - Sep'25",
    "rhs": [
      {
        "prefix": "Net Sales ",
        "suffix": " Growth in half year ended Sep 2025 is -0.64% vs 7.59% in Sep 2024",
        "dir": -1
      },
      {
        "prefix": "Standalone Net Profit ",
        "suffix": " Growth in half year ended Sep 2025 is 35.05% vs 48.61% in Sep 2024",
        "dir": -1
      }
    ],
    "table": {
      "header": [
        "Sep'25",
        "Sep'24",
        "Change(%)"
      ],
      "body": [
        {
          "field": "Net Sales",
          "val1": "207.11",
          "val2": "208.44",
          "chgp": "-0.64%",
          "chgp_class": "negative"
        },
        {
          "field": "Operating Profit (PBDIT) excl Other Income",
          "val1": "20.44",
          "val2": "18.87",
          "chgp": "8.32%",
          "chgp_class": "positive"
        },
        {
          "field": "Interest",
          "val1": "8.75",
          "val2": "9.36",
          "chgp": "-6.52%",
          "chgp_class": "positive"
        },
        {
          "field": "Exceptional Items",
          "val1": "0.00",
          "val2": "0.00",
          "chgp": "",
          "chgp_class": "neutral"
        },
        {
          "field": "Standalone Net Profit",
          "val1": "5.78",
          "val2": "4.28",
          "chgp": "35.05%",
          "chgp_class": "positive"
        },
        {
          "field": "Operating Profit Margin (Excl OI)",
          "val1": "9.87%",
          "val2": "9.05%",
          "chgp": "0.82%",
          "chgp_class": "positive"
        }
      ]
    }
  },
  {
    "link": "nine-monthly",
    "btn_text": "All Nine Monthly Results",
    "header": "Nine Monthly Results Snapshot (Standalone) - Dec'25",
    "rhs": [
      {
        "prefix": "Net Sales ",
        "suffix": "YoY Growth in nine months ended Dec 2025 is 6.52% vs 7.96% in Dec 2024",
        "dir": -1
      },
      {
        "prefix": "Standalone Net Profit ",
        "suffix": "YoY Growth in nine months ended Dec 2025 is 56.66% vs 64.62% in Dec 2024",
        "dir": -1
      }
    ],
    "table": {
      "header": [
        "Dec'25",
        "Dec'24",
        "Change(%)"
      ],
      "body": [
        {
          "field": "Net Sales",
          "val1": "315.69",
          "val2": "296.37",
          "chgp": "6.52%",
          "chgp_class": "positive"
        },
        {
          "field": "Operating Profit (PBDIT) excl Other Income",
          "val1": "32.08",
          "val2": "28.21",
          "chgp": "13.72%",
          "chgp_class": "positive"
        },
        {
          "field": "Interest",
          "val1": "13.09",
          "val2": "14.20",
          "chgp": "-7.82%",
          "chgp_class": "positive"
        },
        {
          "field": "Exceptional Items",
          "val1": "0.00",
          "val2": "0.00",
          "chgp": "",
          "chgp_class": "neutral"
        },
        {
          "field": "Standalone Net Profit",
          "val1": "8.82",
          "val2": "5.63",
          "chgp": "56.66%",
          "chgp_class": "positive"
        },
        {
          "field": "Operating Profit Margin (Excl OI)",
          "val1": "10.16%",
          "val2": "9.52%",
          "chgp": "0.64%",
          "chgp_class": "positive"
        }
      ]
    }
  },
  {
    "link": "annual",
    "btn_text": "All Annual Results",
    "header": "Annual Results Snapshot (Standalone) - Mar'26",
    "rhs": [
      {
        "prefix": "Net Sales ",
        "suffix": "YoY Growth in year ended Mar 2026 is 8.00% vs 7.91% in Mar 2025",
        "dir": 1
      },
      {
        "prefix": "Standalone Net Profit ",
        "suffix": "YoY Growth in year ended Mar 2026 is 29.20% vs 37.27% in Mar 2025",
        "dir": -1
      }
    ],
    "table": {
      "header": [
        "Mar'26",
        "Mar'25",
        "Change(%)"
      ],
      "body": [
        {
          "field": "Net Sales",
          "val1": "435.23",
          "val2": "402.98",
          "chgp": "8.00%",
          "chgp_class": "positive"
        },
        {
          "field": "Operating Profit (PBDIT) excl Other Income",
          "val1": "43.67",
          "val2": "37.97",
          "chgp": "15.01%",
          "chgp_class": "positive"
        },
        {
          "field": "Interest",
          "val1": "18.11",
          "val2": "18.56",
          "chgp": "-2.42%",
          "chgp_class": "positive"
        },
        {
          "field": "Exceptional Items",
          "val1": "0.00",
          "val2": "0.00",
          "chgp": "",
          "chgp_class": "neutral"
        },
        {
          "field": "Standalone Net Profit",
          "val1": "12.61",
          "val2": "9.76",
          "chgp": "29.20%",
          "chgp_class": "positive"
        },
        {
          "field": "Operating Profit Margin (Excl OI)",
          "val1": "10.03%",
          "val2": "9.42%",
          "chgp": "0.61%",
          "chgp_class": "positive"
        }
      ]
    }
  }
]

Quarterly Results Snapshot (Standalone) - Jun'26 - QoQstock-summary

Jun'26
Mar'26
Change(%)
Net Sales
118.28
119.54
-1.05%
Operating Profit (PBDIT) excl Other Income
13.37
11.58
15.46%
Interest
5.57
5.02
10.96%
Exceptional Items
0.00
0.00
Standalone Net Profit
4.15
3.79
9.50%
Operating Profit Margin (Excl OI)
11.30%
9.69%
1.61%
Values in Rs Cr.
Direction Arrows
Net Sales

QoQ Growth in quarter ended Jun 2026 is -1.05% vs 10.09% in Mar 2026

Direction Arrows
Standalone Net Profit

QoQ Growth in quarter ended Jun 2026 is 9.50% vs 24.67% in Mar 2026

Half Yearly Results Snapshot (Standalone) - Sep'25stock-summary

Sep'25
Sep'24
Change(%)
Net Sales
207.11
208.44
-0.64%
Operating Profit (PBDIT) excl Other Income
20.44
18.87
8.32%
Interest
8.75
9.36
-6.52%
Exceptional Items
0.00
0.00
Standalone Net Profit
5.78
4.28
35.05%
Operating Profit Margin (Excl OI)
9.87%
9.05%
0.82%
Values in Rs Cr.
Direction Arrows
Net Sales

Growth in half year ended Sep 2025 is -0.64% vs 7.59% in Sep 2024

Direction Arrows
Standalone Net Profit

Growth in half year ended Sep 2025 is 35.05% vs 48.61% in Sep 2024

Nine Monthly Results Snapshot (Standalone) - Dec'25stock-summary

Dec'25
Dec'24
Change(%)
Net Sales
315.69
296.37
6.52%
Operating Profit (PBDIT) excl Other Income
32.08
28.21
13.72%
Interest
13.09
14.20
-7.82%
Exceptional Items
0.00
0.00
Standalone Net Profit
8.82
5.63
56.66%
Operating Profit Margin (Excl OI)
10.16%
9.52%
0.64%
Values in Rs Cr.
Direction Arrows
Net Sales

YoY Growth in nine months ended Dec 2025 is 6.52% vs 7.96% in Dec 2024

Direction Arrows
Standalone Net Profit

YoY Growth in nine months ended Dec 2025 is 56.66% vs 64.62% in Dec 2024

Annual Results Snapshot (Standalone) - Mar'26stock-summary

Mar'26
Mar'25
Change(%)
Net Sales
435.23
402.98
8.00%
Operating Profit (PBDIT) excl Other Income
43.67
37.97
15.01%
Interest
18.11
18.56
-2.42%
Exceptional Items
0.00
0.00
Standalone Net Profit
12.61
9.76
29.20%
Operating Profit Margin (Excl OI)
10.03%
9.42%
0.61%
Values in Rs Cr.
Direction Arrows
Net Sales

YoY Growth in year ended Mar 2026 is 8.00% vs 7.91% in Mar 2025

Direction Arrows
Standalone Net Profit

YoY Growth in year ended Mar 2026 is 29.20% vs 37.27% in Mar 2025

stock-summaryCompany CV
About Him Teknoforge Ltd stock-summary
stock-summary
Him Teknoforge Ltd
Micro Cap
Auto Components & Equipments
Him Teknoforge Ltd (Erstwhile known Gujarat Automotive Gears Ltd), established in March, 1991 is a leading manufacturer and supplier of a wide variety of quality Forgings and Machined Components (Blanks & Finished Heat Treated) like Transmission Gears, Pins, Axles, Shafts, Non Gear, Assemblies, Sub Assemblies, Spider Kits and repair kits.
Company Coordinates stock-summary
Company Details
Village Billanwadi, Baddi Solan Himachal Pradesh : 173205
stock-summary
Tel: 91-1795-246351/245466
stock-summary
gujarat.gears@gagl.net/gujarat.gear
Registrar Details