
Compare Home First Finan with Similar Stocks
Dashboard
Strong Long Term Fundamental Strength with a 33.46% CAGR growth in Operating Profits
Healthy long term growth as Net Sales has grown by an annual rate of 31.75% and Operating profit at 33.46%
The company has declared Positive results for the last 19 consecutive quarters
With ROE of 12.6, it has a Fair valuation with a 2.8 Price to Book Value
28.63% of Promoter Shares are Pledged
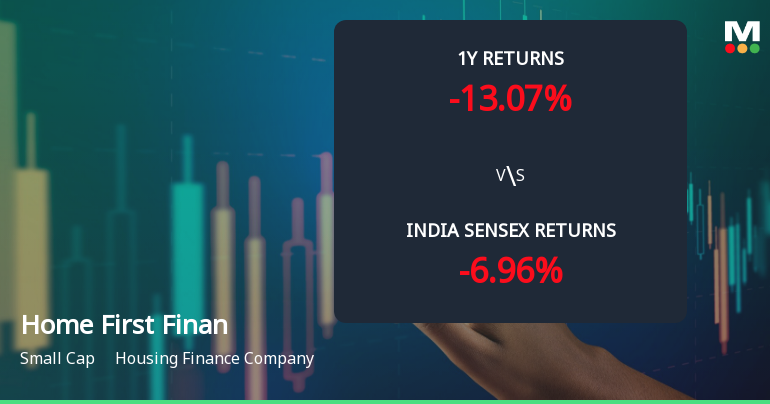
Underperformed the market in the last 1 year
Stock DNA
Housing Finance Company
INR 11,968 Cr (Small Cap)
22.00
12
0.46%
2.47
12.62%
2.74
Total Returns (Price + Dividend) 
Latest dividend: 5.150083876980429 per share ex-dividend date: May-29-2026
Risk Adjusted Returns v/s
Returns Beta

News
Home First Finance Company India Ltd Technical Momentum Shifts Amid Mixed Market Signals
Home First Finance Company India Ltd (NSE: HOMEFIRST) has experienced a notable shift in its technical momentum, transitioning from a sideways trend to a mildly bearish stance. Despite a recent downgrade in daily moving averages and a 2.09% decline in the latest session, the stock exhibits a complex interplay of bullish and bearish signals across weekly and monthly timeframes, reflecting a nuanced outlook for investors in this small-cap housing finance company.
Read full news article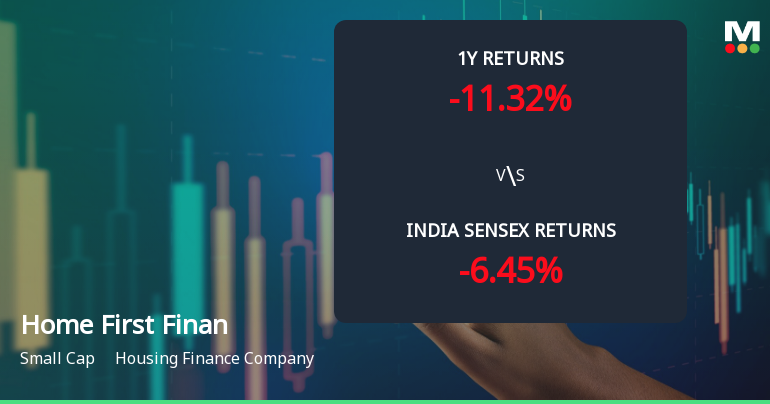
Home First Finance Company India Ltd: Technical Momentum Shifts Amid Mixed Signals
Home First Finance Company India Ltd has experienced a notable shift in its technical momentum, moving from a mildly bullish stance to a more sideways trend. This change is underscored by a complex interplay of technical indicators including MACD, RSI, moving averages, and Bollinger Bands, reflecting a nuanced market sentiment for this small-cap housing finance company.
Read full news article
Home First Finance Company India Ltd is Rated Hold
Home First Finance Company India Ltd is rated 'Hold' by MarketsMOJO. This rating was last updated on 27 May 2026, reflecting a shift from a previous 'Sell' rating. However, the analysis and financial metrics discussed here represent the stock’s current position as of 19 June 2026, providing investors with an up-to-date view of its fundamentals, returns, and overall outlook.
Read full news article Announcements
ESG Score Assigned By ESG Risk Assessments And Insights Limited
20-Jun-2026 | Source : BSEESG Risk Assessments Insights Limited SEBI registered ESG Rating provider has assigned an ESG Score of 75
Announcement under Regulation 30 (LODR)-Analyst / Investor Meet - Intimation
20-Jun-2026 | Source : BSEIntimation of Schedule of Analyst / Institutional Investor meeting under the SEBI (Listing Obligations and Disclosure Requirements) Regulations 2015
Announcement under Regulation 30 (LODR)-Analyst / Investor Meet - Outcome
20-Jun-2026 | Source : BSEOutcome of Schedule of Analyst / Institutional Investor meeting under the SEBI (Listing Obligations and Disclosure Requirements) Regulations 2015
Corporate Actions

No Upcoming Board Meetings

Home First Finance Company India Ltd has declared 260% dividend, ex-date: 29 May 26

No Splits history available

No Bonus history available

No Rights history available
Quality key factors
Valuation key factors
Technicals key factors
 Technical Indicator Scale: Bearish, Mildly Bearish, Sideways, Mildly Bullish, Bullish Turned
 Shareholding Snapshot : Mar 2026
Shareholding Compare (%holding)
FIIs
28.6284
Held by 24 Schemes (19.74%)
Held by 198 FIIs (45.72%)
True North Fund V Llp (4.72%)
Smallcap World Fund, Inc (7.99%)
11.19%
Quarterly Results Snapshot (Standalone) - Mar'26 - QoQ

QoQ Growth in quarter ended Mar 2026 is 3.87% vs 1.03% in Dec 2025
QoQ Growth in quarter ended Mar 2026 is 6.60% vs 6.33% in Dec 2025
Half Yearly Results Snapshot (Standalone) - Sep'25

Growth in half year ended Sep 2025 is 31.18% vs 34.63% in Sep 2024
Growth in half year ended Sep 2025 is 39.31% vs 25.49% in Sep 2024
Nine Monthly Results Snapshot (Standalone) - Dec'25
YoY Growth in nine months ended Dec 2025 is 26.66% vs 35.45% in Dec 2024
YoY Growth in nine months ended Dec 2025 is 40.95% vs 24.80% in Dec 2024
Annual Results Snapshot (Standalone) - Mar'26
YoY Growth in year ended Mar 2026 is 25.08% vs 34.67% in Mar 2025
YoY Growth in year ended Mar 2026 is 41.43% vs 24.97% in Mar 2025
About Home First Finance Company India Ltd

Company Coordinates


