
Compare India Cem. Cap. with Similar Stocks
Stock DNA
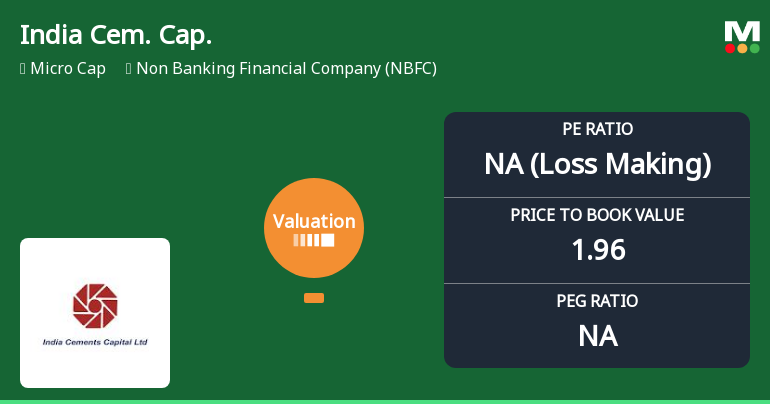
Non Banking Financial Company (NBFC)
INR 32 Cr (Micro Cap)
NA (Loss Making)
20
0.00%
0.00
-1.12%
1.81
Total Returns (Price + Dividend) 
India Cem. Cap. for the last several years.
Risk Adjusted Returns v/s
Returns Beta

News
India Cements Capital Ltd Valuation Shifts Signal Elevated Risk Amid Market Gains
India Cements Capital Ltd, a micro-cap player in the Non Banking Financial Company (NBFC) sector, has seen a marked deterioration in its valuation parameters, prompting a downgrade to a Strong Sell rating. With its price-to-earnings (P/E) ratio plunging to a deeply negative -175.3 and price-to-book value (P/BV) nearing 2, the stock now appears significantly riskier compared to its peers and historical averages.
Read full news articleAre India Cements Capital Ltd latest results good or bad?
India Cements Capital Ltd's latest financial results for Q4 FY26 reveal significant operational challenges. The company reported net sales of ₹1.26 crores, reflecting a year-on-year growth of 4.13%, which indicates some stability in revenue generation. However, this positive aspect is overshadowed by a net loss of ₹0.39 crores, marking an alarming year-on-year decline of 880.00% in profitability. The operating margin, excluding other income, fell sharply to -40.48%, a stark contrast to the previous year’s -2.48%, highlighting severe operational inefficiencies. Furthermore, the profit after tax (PAT) margin also deteriorated, registering at -30.95%, compared to a positive margin of 4.13% in the same quarter last year. The company's financial metrics indicate a struggle with capital efficiency, as evidenced by a return on equity (ROE) of just 0.81% and a return on capital employed (ROCE) of -0.36%. These ...
Read full news article
India Cements Capital Q4 FY26: Mounting Losses Deepen as Operational Challenges Persist
India Cements Capital Ltd., a micro-cap non-banking financial company operating primarily in foreign exchange services, reported a challenging fourth quarter for FY26, with net losses widening dramatically to ₹0.39 crores compared to a modest profit of ₹0.05 crores in Q4 FY25. The company, controlled by the Aruna Sugars group and operating as an RBI-registered Authorized Dealer (Category-II) for money changing activities, saw its stock trading at ₹16.79 on May 29, 2026, reflecting a modest 0.60% gain on the day but masking deeper fundamental concerns that have plagued the organisation throughout the fiscal year.
Read full news article Announcements
Board Meeting Outcome for Board Meeting Outcome For Board Meeting Held On 29.05.2026.
29-May-2026 | Source : BSEBoard Meeting Outcome for Board Meeting Held On 29.05.2026.
Audited Financial Results (Standalone & Consolidated) For The Year Ended 31.03.2026.
29-May-2026 | Source : BSEAudited Financial Results (standalone & Consolidated) for the year ended 31.03.2026
Board Meeting Intimation for Approval Of Audited Annual Accounts For 2025-26 And Publication Of Audited Financial Results For The Quarter And Year Ended 31.03.2026
22-May-2026 | Source : BSEIndia Cements Capital Ltdhas informed BSE that the meeting of the Board of Directors of the Company is scheduled on 29/05/2026 inter alia to consider and approve Audited annual accounts for the year ended 31st March 2026 (both standalone and consolidated) and standalone and consolidated audited financial results for the quarter and year ended 31st March 2026. The Audit Committee of our Board will review the said financial results and accounts at a meeting to be held earlier to the Board meeting on the same day.
Corporate Actions

No Upcoming Board Meetings

No Dividend history available

No Splits history available

No Bonus history available

No Rights history available
Quality key factors
Valuation key factors
Technicals key factors
 Technical Indicator Scale: Bearish, Mildly Bearish, Sideways, Mildly Bullish, Bullish Turned
 Shareholding Snapshot : Mar 2026
Shareholding Compare (%holding)
Promoters
None
Held by 1 Schemes (0.0%)
Held by 0 FIIs
Sri Saradha Logistics Private Limited (50.02%)
Maitreyan Amarnath (24.68%)
48.8%
Quarterly Results Snapshot (Consolidated) - Mar'26 - YoY

YoY Growth in quarter ended Mar 2026 is 4.13% vs -20.39% in Mar 2025

YoY Growth in quarter ended Mar 2026 is -880.00% vs -64.29% in Mar 2025
Half Yearly Results Snapshot (Consolidated) - Sep'25
Growth in half year ended Sep 2025 is -18.59% vs -15.45% in Sep 2024
Growth in half year ended Sep 2025 is -76.92% vs -54.39% in Sep 2024
Nine Monthly Results Snapshot (Consolidated) - Dec'25
YoY Growth in nine months ended Dec 2025 is -14.38% vs -17.67% in Dec 2024
YoY Growth in nine months ended Dec 2025 is -114.00% vs -63.50% in Dec 2024
Annual Results Snapshot (Consolidated) - Mar'26
YoY Growth in year ended Mar 2026 is -10.38% vs -18.27% in Mar 2025
YoY Growth in year ended Mar 2026 is -180.36% vs -62.91% in Mar 2025
About India Cements Capital Ltd

Company Coordinates


