India Homes

  • Market Cap: Micro Cap
  • Industry: Iron & Steel Products
  • ISIN: INE072A01029
  • NSEID:
  • BSEID: 513361
INR
24.85
2.56 (11.48%)
BSENSE

Aug 10, 03:30 PM

BSE+NSE Vol: 16.19 lacs

  • Price Points
  • Score
  • Mojo Parameters
  • Total Return
  • News and Corporate Actions
  • Key factors
  • Shareholding
  • Financials
  • CompanyCV
stock-summaryPrice Point
High/Low

1Day

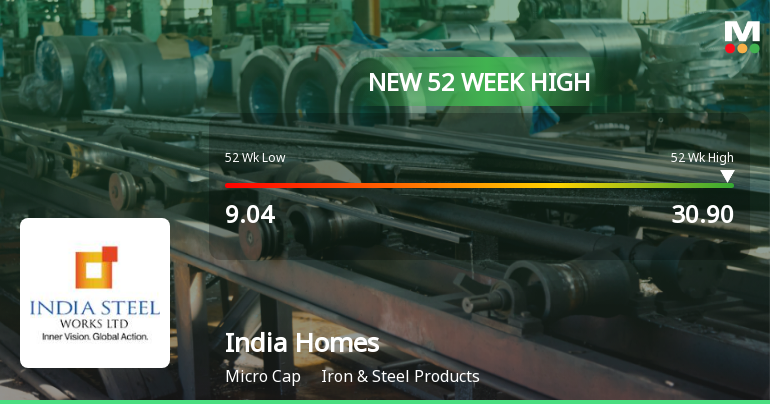
52 Week

Valuation
Technical
Day's Volume

CASH

16.19 lacs (125.59%) Volume

Shareholding (Jun 2026)

FII

0.00%

Held by 0 FIIs

DII

4.87%

Held by 2 DIIs

Promoter

34.25%

Why is India Homes Ltd falling/rising?

10-Aug-2026

As of 09-Aug, the stock price of India Homes Ltd is declining at 22.29, down -0.13%. The stock has lost value for three consecutive days, with negative returns over the past week and month, while investor participation is decreasing significantly.

As of 09-Aug, the stock price of India Homes Ltd is falling, currently at 22.29, reflecting a change of -0.03 (-0.13%). The stock has been on a downward trend, having lost value for the last three consecutive days, resulting in a total decline of -0.71% during this period. Additionally, the stock's performance over the past week and month has been negative, with returns of -0.45% and -1.89%, respectively, while the benchmark Sensex has shown positive returns of +0.52% and +0.41% in the same periods.<BR><BR>Investor participation appears to be decreasing, as indicated by a significant drop in delivery volume, which fell by -81.76% compared to the 5-day average. Although the stock is trading above its 5-day, 20-day, 100-day, and 200-day moving averages, it is below the 50-day moving average, suggesting a weakening momentum. Overall, these factors contribute to the stock's current decline.

View full answer

Should I buy, sell or hold India Homes Ltd?

04-Aug-2026

When is the next results date for India Homes Ltd?

31-Jul-2026

The next results date for India Homes Ltd is 03 August 2026.

The next results date for India Homes Ltd is scheduled for 03 August 2026.

View full answer

How big is India Homes?

11-Jun-2026

As of 10th June, India Homes Ltd has a market capitalization of 876.00 Cr and reported net sales of 2.65 Cr with a net loss of 29.54 Cr over the last four quarters. Shareholder's funds are valued at 48.53 Cr, with total assets of 412.65 Cr as of March 2023.

As of 10th June, <BR><BR>Market Cap: India Homes Ltd has a market capitalization of 876.00 Cr and is classified as a Micro Cap.<BR><BR>Recent Quarterly Performance: The sum of Net Sales for the latest 4 quarters is 2.65 Cr, while the sum of Net Profit for the same period reflects a loss of 29.54 Cr.<BR><BR>Balance Sheet Snapshot: The reporting period for the balance sheet is March 2023. Shareholder's Funds are valued at 48.53 Cr, and Total Assets amount to 412.65 Cr.

View full answer

Who are in the management team of India Homes?

11-Jun-2026

The management team of India Homes includes Varun S Gupta (Managing Director), Sudhirkumar H Gupta (Chairman & Executive Director), and several independent directors, including Bimal Desai and Bhavna B Devda. They oversee the company's operations and governance.

The management team of India Homes includes the following individuals:<BR><BR>1. **Varun S Gupta** - Managing Director<BR>2. **Sudhirkumar H Gupta** - Chairman & Executive Director<BR>3. **Dilip Maharana** - Company Secretary & Compliance Officer<BR>4. **Bimal Desai** - Non-Executive & Independent Director<BR>5. **Bhavna B Devda** - Independent Director<BR>6. **Santino Racco Morea** - Independent Director<BR>7. **Harpreet Baweja** - Independent Director<BR>8. **Santosh Pandharinath Bhosale** - Independent Director<BR>9. **Shivanand Shesherao Bhalerao** - Independent Director<BR>10. **Saachi Madnani** - Additional Independent Director<BR><BR>This team is responsible for overseeing the company's operations and governance.

View full answer

Who are the peers of the India Homes?

11-Jun-2026

India Homes' peers include Mangalam World, Gandhi Spl. Tube, Cosmic CRF, Rama Steel Tubes, Uni Abex Alloy, Beekay Steel Ind, Kamdhenu, Scoda Tubes, and Panchmahal Steel. India Homes has the highest 1-year return at 278.98%, while Rama Steel Tubes has the lowest at -61.68%.

Peers: The peers of India Homes are Mangalam World., Gandhi Spl. Tube, Cosmic CRF, Rama Steel Tubes, Uni Abex Alloy, Beekay Steel Ind, Kamdhenu, Scoda Tubes, and Panchmahal Steel.<BR><BR>Quality Snapshot: Excellent management risk is observed at Mangalam World. and Cosmic CRF, while Average management risk is found at Gandhi Spl. Tube, Rama Steel Tubes, Uni Abex Alloy, Beekay Steel Ind, Kamdhenu, Scoda Tubes, and Panchmahal Steel, and the rest. Growth is Excellent at Mangalam World. and Cosmic CRF, Good at Scoda Tubes, Average at Uni Abex Alloy, and Below Average at Gandhi Spl. Tube, India Homes, Rama Steel Tubes, Beekay Steel Ind, Kamdhenu, and Panchmahal Steel, and the rest. Capital Structure is Excellent at Gandhi Spl. Tube, Uni Abex Alloy, and Kamdhenu, Good at Beekay Steel Ind, Below Average at India Homes, Rama Steel Tubes, and the rest, and Average at Scoda Tubes and Panchmahal Steel.<BR><BR>Return Snapshot: The peer with the highest 1-year return is India Homes at 278.98%, while the peer with the lowest is Rama Steel Tubes at -61.68%. India Homes' 1-year return significantly exceeds that of all its peers. Additionally, the peers with negative six-month returns include Rama Steel Tubes, Cosmic CRF, and Beekay Steel Ind.

View full answer

What does India Homes do?

10-Jun-2026

India Homes Ltd operates in the Iron & Steel Products industry as a Micro Cap company, reporting net sales of 24 Cr and a net profit of 23 Cr for March 2026. The company, formerly known as Khanna & Roy Heavy Engineering Limited, has a market cap of INR 876 Cr and a debt-equity ratio of 2.01.

Overview: <BR>India Homes Ltd operates in the Iron & Steel Products industry and is categorized as a Micro Cap company.<BR><BR>History: <BR>India Homes Limited was initially incorporated as 'Khanna & Roy Heavy Engineering Limited' in 1987. The company underwent several name changes, including 'Isibars Limited' in May 1991 and 'India Steel Works Limited', before adopting its current name, India Homes Limited, with approval from the Ministry of Corporate Affairs on July 17, 2025. The latest reported quarterly results show net sales and net profit for March 2026.<BR><BR>Financial Snapshot: <BR>Net Sales: 24 Cr (Quarterly Results - Mar 2026) <BR>Net Profit: 23 Cr (Quarterly Results - Mar 2026) <BR>Market Cap: INR 876 Cr (Micro Cap)<BR><BR>Key Metrics: <BR>P/E: N/A <BR>Industry P/E: 26 <BR>Dividend Yield: 0.00% <BR>Debt-Equity: 2.01 <BR>Return on Equity: 41.44% <BR>Price to Book: 19.71<BR><BR>Contact Details: <BR>Address: Zenith Compound, Khopoli Raigad Maharashtra : 410203 <BR>Tel: 91-02192 265812 <BR>Email: cosec@indiasteel.in <BR>Website: http://www.indiasteel.in

View full answer

How has been the historical performance of India Homes?

17-Nov-2025

India Homes has experienced a significant decline in financial performance, with net sales dropping from 967.29 crore in March 2018 to 4.71 crore in March 2023, and increasing losses reflected in a net profit of -35.92 crore in March 2023 compared to a profit of 4.20 crore in March 2018. The company's total assets and liabilities also decreased during this period, indicating ongoing financial challenges.

Answer:<BR>The historical performance of India Homes shows a significant decline in net sales and profitability over the years, culminating in a challenging financial position as of March 2023.<BR><BR>Breakdown:<BR>India Homes experienced a drastic decrease in net sales from 967.29 crore in March 2018 to just 4.71 crore in March 2023. The total operating income followed a similar trend, dropping from 967.29 crore in March 2018 to 4.71 crore in March 2023. The company's total expenditure also decreased significantly, from 966.72 crore in March 2018 to 24.68 crore in March 2023. However, despite this reduction in costs, the operating profit (PBDIT) remained negative, reaching -19.97 crore in March 2023 compared to -0.44 crore in March 2021. The profit before tax showed a similar negative trajectory, with losses increasing from -5.40 crore in March 2019 to -35.92 crore in March 2023. The consolidated net profit also reflected this trend, with losses of -35.92 crore in March 2023 compared to a profit of 4.20 crore in March 2018. The company's total assets decreased from 594.08 crore in March 2019 to 412.65 crore in March 2023, while total liabilities also declined from 594.08 crore to 412.65 crore in the same period. Overall, India Homes has faced significant financial challenges, leading to a deteriorating performance across key metrics over the years.

View full answer

Is India Homes technically bullish or bearish?

04-Nov-2025

As of November 3, 2025, the technical trend for India Homes is mildly bullish, supported by daily moving averages and Bollinger Bands, but tempered by mixed signals from weekly MACD, KST, and monthly RSI, indicating a cautious outlook.

As of 3 November 2025, the technical trend has changed from bullish to mildly bullish. The current stance is mildly bullish, driven by daily moving averages indicating bullish momentum, while the weekly MACD and KST are mildly bearish, suggesting some caution. The monthly MACD remains bullish, and Bollinger Bands are bullish on both weekly and monthly time frames, providing support for the overall positive outlook. However, the RSI on a monthly basis is bearish, indicating potential weakness. The Dow Theory shows no clear trend in both weekly and monthly perspectives. Overall, the mixed signals suggest a cautious but slightly positive outlook for India Homes.

View full answer

Are India Steel latest results good or bad?

01-Aug-2025

India Steel's latest results show a strong increase in net sales and profit for June 2025, but a flat performance in March 2025 and a 'Sell' call from MarketsMOJO indicate mixed sentiment, suggesting investors may view the results unfavorably.

India Steel Works' latest financial results indicate a mixed performance. While there was a notable increase in net sales and standalone net profit for the quarter ending June 2025, the overall assessment for the quarter ending March 2025 shows flat performance, with no significant growth or decline compared to previous quarters.<BR><BR>Specifically, the company reported a 100% growth in net sales and a 55.15% increase in standalone net profit for the June quarter. However, the performance score has decreased from 1 to 0, suggesting challenges in maintaining operational efficiency or revenue growth. Additionally, MarketsMOJO has issued a 'Sell' call on the stock, reflecting a cautious outlook.<BR><BR>Overall, while there are some positive indicators in the recent quarter, the lack of momentum and the cautious market sentiment suggest that the results may not be viewed favorably by investors.

View full answer

Is India Steel overvalued or undervalued?

09-Jun-2025

As of April 25, 2023, India Steel is considered risky and overvalued, with poor financial ratios compared to peers, despite a strong one-year stock return of 60.45%.

As of 25 April 2023, the valuation grade for India Steel has moved from does not qualify to risky. Based on the analysis, the company appears to be overvalued. Key ratios indicate significant financial distress, with a PE ratio of -8.18, an EV to EBITDA of -23.05, and a ROE of -73.97%. <BR><BR>In comparison to its peers, India Steel's valuation metrics are starkly unfavorable; for instance, JSW Steel has a PE ratio of 64.98 and an EV to EBITDA of 14.20, while Tata Steel boasts a PE of 51.92 and an EV to EBITDA of 11.04. These comparisons highlight the substantial gap in performance and valuation between India Steel and its more stable competitors. Additionally, despite a strong one-year stock return of 60.45%, which outperformed the Sensex's 7.62%, the underlying financial ratios suggest that the company's current market price does not reflect its actual value, reinforcing the conclusion of overvaluation.

View full answer

Who are the top shareholders of the India Steel?

06-Jun-2025

The top shareholders of India Steel include Metal Industrial Pte Ltd with 22.72%, India Steel International (P) Ltd at 11.08%, and individual investors holding 28.32%. Additionally, five foreign institutional investors hold a combined 0.07%, while three mutual funds currently hold no shares.

The top shareholders of India Steel include a mix of institutional and individual investors. The largest public shareholder is Metal Industrial Pte Ltd, holding 22.72%. Among the promoters, India Steel International (P) Ltd has the highest stake at 11.08%. Additionally, individual investors collectively hold 28.32% of the shares. Notably, there are also five foreign institutional investors (FIIs) with a combined holding of 0.07%, and three mutual funds that currently hold no shares in the company.

View full answer

Has India Steel declared dividend?

06-Jun-2025

No Dividend History Available

iScoreScore
Click here to find our call on this stock
Strong Sell
Sell
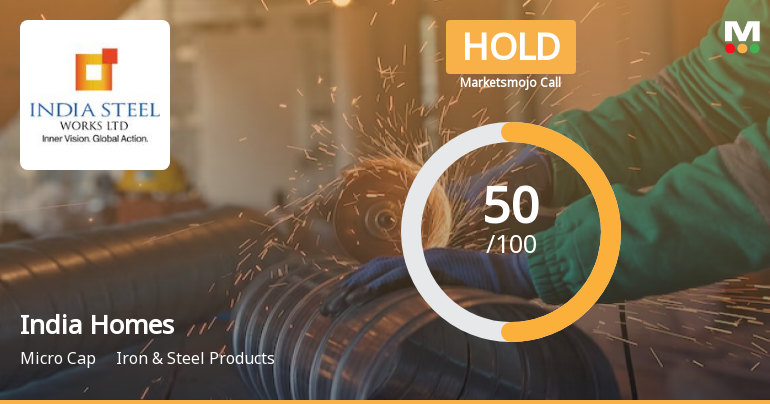
Hold
Buy
Strong Buy

Dashboard

1

With a Operating Losses, the company has a Weak Long Term Fundamental Strength

  • Low ability to service debt as the company has a high Debt to EBITDA ratio of 4.52 times
  • The company has been able to generate a Return on Equity (avg) of 8.29% signifying low profitability per unit of shareholders funds
2

Positive results in Jun 26

3

With ROCE of 14.8, it has a Very Expensive valuation with a 8 Enterprise value to Capital Employed

4

Reducing Promoter Confidence

5

Consistent Returns over the last 3 years

stock-summaryMojo Parameters

Mojo Parameters

Loading Valuation Snapshot...

Stock DNA

stock-summary
Industry

Iron & Steel Products

stock-summary
Market cap

INR 893 Cr (Micro Cap)

stock-summary
P/E

NA (Loss Making)

stock-summary
Industry P/E

25

stock-summary
Dividend Yield

0.00%

stock-summary
Debt Equity

2.01

stock-summary
Return on Equity

37.59%

stock-summary
Price to Book

19.71

Revenue and Profits:
Net Sales:
(Quarterly Results - Jun 2026)
Net Profit:
3 Cr
stock-summaryTotal Returns
Total Returns (Price + Dividend) stock-summary
Dividend Yield (0%)
TimePeriod
Price Return
Dividend Return
Total Return
3 Months
6.93%
0%
6.93%
6 Months
87.97%
0%
87.97%
1 Year
123.07%
0%
123.07%
2 Years
550.52%
0%
550.52%
3 Years
1207.89%
0%
1207.89%
4 Years
827.24%
0%
827.24%
5 Years
1344.77%
0%
1344.77%

India Homes for the last several years.

Risk Adjusted Returns v/s stock-summary
Returns Beta
Icon
Beta has not been calculated since enough price history is not available
stock-summaryNews & Corporate Actions

News

India Homes Ltd Declines 0.45% Despite Technical Momentum Shift and Mixed Quarterly Results

Announcements stock-summary

Announcement under Regulation 30 (LODR)-Newspaper Publication

05-Aug-2026 | Source : BSE

NEWS paper Publication of Un-Audited Financial Results of the Company for the Quarter ended 30 06 2026 published in Free Press Journal & Navashakti

Revised Disclosure Under Regulation 30 Of The SEBI (Listing Obligations And Disclosure Requirements) Regulations 2015 - Receipt Of Notice From The Office Of The Regional Director Western Region Mumbai-II.

04-Aug-2026 | Source : BSE

Receipt of notice dtd.24 07 2026 on 30 07 2026 at the end of the day by the Directors of the Company as detailed in the disclosure.

Announcement under Regulation 30 (LODR)-Acquisition

03-Aug-2026 | Source : BSE

Approval of the proposal for investment in Level Enterprises LLP a related party as detailed in the attached outcome sr.no.2 and annexure -III attached to the said outcome.

Corporate Actions stock-summary

stock-summary
BOARD MEETING

No Upcoming Board Meetings

stock-summary
DIVIDEND

No Dividend history available

stock-summary
SPLITS

No Splits history available

stock-summary
BONUS

No Bonus history available

stock-summary
RIGHTS

No Rights history available

stock-summaryKey Factors

Quality key factors stock-summary

Factor
Value
Sales Growth (5y)
-29.85%
EBIT Growth (5y)
19.96%
EBIT to Interest (avg)
-2.79
Debt to EBITDA (avg)
Negative Net Debt
Net Debt to Equity (avg)
2.01
Sales to Capital Employed (avg)
0.04
Tax Ratio
0
Dividend Payout Ratio
0
Pledged Shares
9.92%
Institutional Holding
4.87%
ROCE (avg)
-9.26%
ROE (avg)
8.29%

Valuation key factors

Factor
Value
P/E Ratio
NA (Loss Making)
Industry P/E
25
Price to Book Value
21.98
EV to EBIT
55.54
EV to EBITDA
55.20
EV to Capital Employed
7.97
EV to Sales
44.11
PEG Ratio
0.25
Dividend Yield
NA
ROCE (Latest)
14.83%
ROE (Latest)
37.59%

Technicals key factors

Indicator
Weekly
Monthly
MACD
Mildly Bearish
Bullish
RSI
No Signal
No Signal
Bollinger Bands
Bullish
Bullish
Moving Averages
Bullish (Daily)
KST
Mildly Bearish
Bullish
Dow Theory
Mildly Bullish
Mildly Bearish
stock-summary Technical Indicator Scale: Bearish, Mildly Bearish, Sideways, Mildly Bullish, Bullish  Turned 
stock-summaryShareholding
Shareholding Snapshot : Jun 2026stock-summary
Shareholding Compare (%holding) stock-summary
Majority shareholders

Non Institution

Pledged Promoter Holdings

9.9193

Mutual Funds

Held by 3 Schemes (0.0%)

FIIs

Held by 0 FIIs

Promoter with highest holding

Yeotmal Land Development & Trading Co (p) Ltd (10.97%)

Highest Public shareholder

Tb Investments Ltd (6.78%)

Individual Investors Holdings

23.89%

stock-summaryFinancial
[
  {
    "link": "quarterly",
    "btn_text": "All Quarterly Results",
    "header": "Quarterly Results Snapshot (Standalone) - Jun'26 - QoQ",
    "rhs": [
      {
        "prefix": "Net Sales ",
        "suffix": "QoQ Growth in quarter ended Jun 2026 is -100.00% vs 0.00% in Mar 2026",
        "dir": -1
      },
      {
        "prefix": "Standalone Net Profit ",
        "suffix": "QoQ Growth in quarter ended Jun 2026 is -84.95% vs 5,213.95% in Mar 2026",
        "dir": -1
      }
    ],
    "table": {
      "header": [
        "Jun'26",
        "Mar'26",
        "Change(%)"
      ],
      "body": [
        {
          "field": "Net Sales",
          "val1": "0.00",
          "val2": "24.48",
          "chgp": "-100.00%",
          "chgp_class": "negative"
        },
        {
          "field": "Operating Profit (PBDIT) excl Other Income",
          "val1": "-1.62",
          "val2": "23.20",
          "chgp": "-106.98%",
          "chgp_class": "negative"
        },
        {
          "field": "Interest",
          "val1": "1.79",
          "val2": "1.80",
          "chgp": "-0.56%",
          "chgp_class": "positive"
        },
        {
          "field": "Exceptional Items",
          "val1": "6.65",
          "val2": "0.00",
          "chgp": "",
          "chgp_class": "neutral"
        },
        {
          "field": "Standalone Net Profit",
          "val1": "3.44",
          "val2": "22.85",
          "chgp": "-84.95%",
          "chgp_class": "negative"
        },
        {
          "field": "Operating Profit Margin (Excl OI)",
          "val1": "0.00%",
          "val2": "94.77%",
          "chgp": "-94.77%",
          "chgp_class": "negative"
        }
      ]
    }
  },
  {
    "link": "half-yearly",
    "btn_text": "All Half Yearly Results",
    "header": "Half Yearly Results Snapshot (Standalone) - Sep'25",
    "rhs": [
      {
        "prefix": "Net Sales ",
        "suffix": " Growth in half year ended Sep 2025 is 0.00% vs -100.00% in Sep 2024",
        "dir": 1
      },
      {
        "prefix": "Standalone Net Profit ",
        "suffix": " Growth in half year ended Sep 2025 is 30.63% vs 41.99% in Sep 2024",
        "dir": -1
      }
    ],
    "table": {
      "header": [
        "Sep'25",
        "Sep'24",
        "Change(%)"
      ],
      "body": [
        {
          "field": "Net Sales",
          "val1": "0.02",
          "val2": "0.00",
          "chgp": "",
          "chgp_class": "neutral"
        },
        {
          "field": "Operating Profit (PBDIT) excl Other Income",
          "val1": "-2.28",
          "val2": "-3.34",
          "chgp": "31.74%",
          "chgp_class": "positive"
        },
        {
          "field": "Interest",
          "val1": "2.53",
          "val2": "2.81",
          "chgp": "-9.96%",
          "chgp_class": "positive"
        },
        {
          "field": "Exceptional Items",
          "val1": "0.00",
          "val2": "2.26",
          "chgp": "-100.00%",
          "chgp_class": "negative"
        },
        {
          "field": "Standalone Net Profit",
          "val1": "-4.62",
          "val2": "-6.66",
          "chgp": "30.63%",
          "chgp_class": "positive"
        },
        {
          "field": "Operating Profit Margin (Excl OI)",
          "val1": "-11,400.00%",
          "val2": "0.00%",
          "chgp": "-11,400.00%",
          "chgp_class": "negative"
        }
      ]
    }
  },
  {
    "link": "nine-monthly",
    "btn_text": "All Nine Monthly Results",
    "header": "Nine Monthly Results Snapshot (Standalone) - Dec'25",
    "rhs": [
      {
        "prefix": "Net Sales ",
        "suffix": "YoY Growth in nine months ended Dec 2025 is 0.00% vs -100.00% in Dec 2024",
        "dir": 1
      },
      {
        "prefix": "Standalone Net Profit ",
        "suffix": "YoY Growth in nine months ended Dec 2025 is 58.47% vs 43.22% in Dec 2024",
        "dir": 1
      }
    ],
    "table": {
      "header": [
        "Dec'25",
        "Dec'24",
        "Change(%)"
      ],
      "body": [
        {
          "field": "Net Sales",
          "val1": "0.02",
          "val2": "0.00",
          "chgp": "",
          "chgp_class": "neutral"
        },
        {
          "field": "Operating Profit (PBDIT) excl Other Income",
          "val1": "-3.00",
          "val2": "-4.60",
          "chgp": "34.78%",
          "chgp_class": "positive"
        },
        {
          "field": "Interest",
          "val1": "2.78",
          "val2": "3.38",
          "chgp": "-17.75%",
          "chgp_class": "positive"
        },
        {
          "field": "Exceptional Items",
          "val1": "0.00",
          "val2": "2.26",
          "chgp": "-100.00%",
          "chgp_class": "negative"
        },
        {
          "field": "Standalone Net Profit",
          "val1": "-4.19",
          "val2": "-10.09",
          "chgp": "58.47%",
          "chgp_class": "positive"
        },
        {
          "field": "Operating Profit Margin (Excl OI)",
          "val1": "-15,000.00%",
          "val2": "0.00%",
          "chgp": "-15,000.00%",
          "chgp_class": "negative"
        }
      ]
    }
  },
  {
    "link": "annual",
    "btn_text": "All Annual Results",
    "header": "Annual Results Snapshot (Standalone) - Mar'26",
    "rhs": [
      {
        "prefix": "Net Sales ",
        "suffix": "YoY Growth in year ended Mar 2026 is 2,44,900.00% vs -98.78% in Mar 2025",
        "dir": 1
      },
      {
        "prefix": "Standalone Net Profit ",
        "suffix": "YoY Growth in year ended Mar 2026 is 239.36% vs -15.23% in Mar 2025",
        "dir": 1
      }
    ],
    "table": {
      "header": [
        "Mar'26",
        "Mar'25",
        "Change(%)"
      ],
      "body": [
        {
          "field": "Net Sales",
          "val1": "24.50",
          "val2": "0.01",
          "chgp": "2,44,900.00%",
          "chgp_class": "positive"
        },
        {
          "field": "Operating Profit (PBDIT) excl Other Income",
          "val1": "20.21",
          "val2": "-5.70",
          "chgp": "454.56%",
          "chgp_class": "positive"
        },
        {
          "field": "Interest",
          "val1": "4.58",
          "val2": "4.20",
          "chgp": "9.05%",
          "chgp_class": "negative"
        },
        {
          "field": "Exceptional Items",
          "val1": "0.00",
          "val2": "2.26",
          "chgp": "-100.00%",
          "chgp_class": "negative"
        },
        {
          "field": "Standalone Net Profit",
          "val1": "18.66",
          "val2": "-13.39",
          "chgp": "239.36%",
          "chgp_class": "positive"
        },
        {
          "field": "Operating Profit Margin (Excl OI)",
          "val1": "82.49%",
          "val2": "-57,000.00%",
          "chgp": "57,082.49%",
          "chgp_class": "positive"
        }
      ]
    }
  }
]

Quarterly Results Snapshot (Standalone) - Jun'26 - QoQstock-summary

Jun'26
Mar'26
Change(%)
Net Sales
0.00
24.48
-100.00%
Operating Profit (PBDIT) excl Other Income
-1.62
23.20
-106.98%
Interest
1.79
1.80
-0.56%
Exceptional Items
6.65
0.00
Standalone Net Profit
3.44
22.85
-84.95%
Operating Profit Margin (Excl OI)
0.00%
94.77%
-94.77%
Values in Rs Cr.
Direction Arrows
Net Sales

QoQ Growth in quarter ended Jun 2026 is -100.00% vs 0.00% in Mar 2026

Direction Arrows
Standalone Net Profit

QoQ Growth in quarter ended Jun 2026 is -84.95% vs 5,213.95% in Mar 2026

Half Yearly Results Snapshot (Standalone) - Sep'25stock-summary

Sep'25
Sep'24
Change(%)
Net Sales
0.02
0.00
Operating Profit (PBDIT) excl Other Income
-2.28
-3.34
31.74%
Interest
2.53
2.81
-9.96%
Exceptional Items
0.00
2.26
-100.00%
Standalone Net Profit
-4.62
-6.66
30.63%
Operating Profit Margin (Excl OI)
-11,400.00%
0.00%
-11,400.00%
Values in Rs Cr.
Direction Arrows
Net Sales

Growth in half year ended Sep 2025 is 0.00% vs -100.00% in Sep 2024

Direction Arrows
Standalone Net Profit

Growth in half year ended Sep 2025 is 30.63% vs 41.99% in Sep 2024

Nine Monthly Results Snapshot (Standalone) - Dec'25stock-summary

Dec'25
Dec'24
Change(%)
Net Sales
0.02
0.00
Operating Profit (PBDIT) excl Other Income
-3.00
-4.60
34.78%
Interest
2.78
3.38
-17.75%
Exceptional Items
0.00
2.26
-100.00%
Standalone Net Profit
-4.19
-10.09
58.47%
Operating Profit Margin (Excl OI)
-15,000.00%
0.00%
-15,000.00%
Values in Rs Cr.
Direction Arrows
Net Sales

YoY Growth in nine months ended Dec 2025 is 0.00% vs -100.00% in Dec 2024

Direction Arrows
Standalone Net Profit

YoY Growth in nine months ended Dec 2025 is 58.47% vs 43.22% in Dec 2024

Annual Results Snapshot (Standalone) - Mar'26stock-summary

Mar'26
Mar'25
Change(%)
Net Sales
24.50
0.01
2,44,900.00%
Operating Profit (PBDIT) excl Other Income
20.21
-5.70
454.56%
Interest
4.58
4.20
9.05%
Exceptional Items
0.00
2.26
-100.00%
Standalone Net Profit
18.66
-13.39
239.36%
Operating Profit Margin (Excl OI)
82.49%
-57,000.00%
57,082.49%
Values in Rs Cr.
Direction Arrows
Net Sales

YoY Growth in year ended Mar 2026 is 2,44,900.00% vs -98.78% in Mar 2025

Direction Arrows
Standalone Net Profit

YoY Growth in year ended Mar 2026 is 239.36% vs -15.23% in Mar 2025

stock-summaryCompany CV
About India Homes Ltd stock-summary
stock-summary
India Homes Ltd
Micro Cap
Iron & Steel Products
India Homes Limited was initially incorporated as 'Khanna & Roy Heavy Engineering Limited' in 1987. The Company was acquired by the present Promoter H L Gupta, who took over the firm in 1990 and renamed it as 'Isibars Limited' in May, 1991. Thereafter, it was changed to India Steel Works Limited and now has changed to India Homes Limited with prior approval from the Ministry of Corporate Affairs on July 17, 2025.
Company Coordinates stock-summary
Company Details
Zenith Compound, Khopoli Raigad Maharashtra : 410203
stock-summary
Tel: 91-02192 265812
stock-summary
cosec@indiasteel.in
Registrar Details
Link Intime India Pvt Ltd, C-13 Pannalal Silk Compound, L B S Marg, Bhandup , Mumbai