
Compare Indostar Capital with Similar Stocks
Dashboard
With a Operating Losses, the company has a Weak Long Term Fundamental Strength
- Poor long term growth as Operating profit has grown by an annual rate of -188.20%
- PBT LESS OI(Q) At Rs -424.03 cr has Fallen at -255.6% (vs previous 4Q average)
- PAT(Q) At Rs -423.93 cr has Fallen at -422.4% (vs previous 4Q average)
- CASH AND CASH EQUIVALENTS(HY) Lowest at Rs 310.38 cr
Risky - Negative EBITDA
Despite the size of the company, domestic mutual funds hold only 0% of the company
Underperformed the market in the last 1 year
Stock DNA
Non Banking Financial Company (NBFC)
INR 4,126 Cr (Small Cap)
NA (Loss Making)
21
0.00%
1.45
-20.12%
1.07
Total Returns (Price + Dividend) 
Latest dividend: 1 per share ex-dividend date: Nov-19-2019
Risk Adjusted Returns v/s
Returns Beta

News

Indostar Capital Finance Ltd Faces Mixed Technical Signals Amid Mildly Bearish Momentum
Indostar Capital Finance Ltd, a small-cap player in the Non Banking Financial Company (NBFC) sector, has experienced a notable shift in its technical momentum, moving from a mildly bullish to a mildly bearish stance. Despite a strong MarketsMOJO score of 9.0, the company’s technical indicators present a complex picture, with mixed signals across weekly and monthly timeframes, prompting a downgrade in its mojo grade to Strong Sell as of 12 May 2026.
Read full news article
Indostar Capital Finance Ltd is Rated Strong Sell
Indostar Capital Finance Ltd is rated 'Strong Sell' by MarketsMOJO, with this rating last updated on 12 May 2026. However, the analysis and financial metrics discussed here reflect the stock's current position as of 26 June 2026, providing investors with the latest insights into the company’s performance and outlook.
Read full news article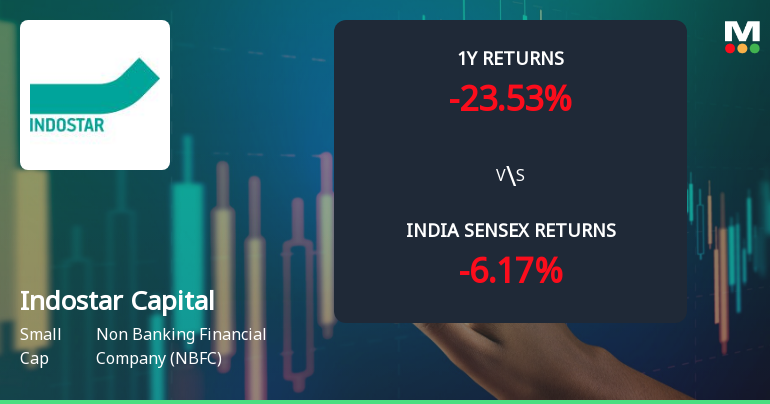
Indostar Capital Finance Ltd Shows Mixed Technical Signals Amid Price Momentum Shift
Indostar Capital Finance Ltd, a small-cap player in the Non Banking Financial Company (NBFC) sector, has experienced a notable shift in its technical momentum, moving from a mildly bearish stance to a mildly bullish one. Despite a strong day change of 6.19%, the stock’s technical indicators present a nuanced picture, reflecting both optimism and caution for investors navigating this evolving landscape.
Read full news article Announcements
IndoStar Capital Finance Limited - Analysts/Institutional Investor Meet/Con. Call Updates
03-Dec-2019 | Source : NSEIndoStar Capital Finance Limited has informed the Exchange regarding Analysts/Institutional Investor Meet/Con. Call Updates
IndoStar Capital Finance Limited - Allotment of Securities
26-Nov-2019 | Source : NSEIndoStar Capital Finance Limited has informed the Exchange regarding allotment of 250 securities pursuant to Non Convertible Securities at its meeting held on November 25, 2019. The Company has allotted 250 Series XXXIV Secured, Rated, Listed, Redeemable, Non-Convertible Debentures of Face Value of INR 10 Lakhs each, for cash at par, aggregating to INR 25 Crore on Private Placement basis.
IndoStar Capital Finance Limited - Analysts/Institutional Investor Meet/Con. Call Updates
14-Nov-2019 | Source : NSEIndoStar Capital Finance Limited has informed the Exchange regarding Analysts/Institutional Investor Meet/Con. Call Updates
Corporate Actions

No Upcoming Board Meetings

Indostar Capital Finance Ltd has declared 10% dividend, ex-date: 19 Nov 19

No Splits history available

No Bonus history available

No Rights history available
Quality key factors
Valuation key factors
Technicals key factors
 Technical Indicator Scale: Bearish, Mildly Bearish, Sideways, Mildly Bullish, Bullish Turned
 Shareholding Snapshot : Mar 2026
Shareholding Compare (%holding)
Promoters
None
Held by 1 Schemes (0.0%)
Held by 23 FIIs (2.59%)
Bcp V Multiple Holdings Pte Ltd. (55.98%)
Florintree Tecserv Llp (6.73%)
12.29%
Quarterly Results Snapshot (Consolidated) - Mar'26 - QoQ

QoQ Growth in quarter ended Mar 2026 is 0.08% vs -2.85% in Dec 2025

QoQ Growth in quarter ended Mar 2026 is -5,207.59% vs -20.88% in Dec 2025
Half Yearly Results Snapshot (Consolidated) - Sep'25
Growth in half year ended Sep 2025 is 6.33% vs 38.88% in Sep 2024
Growth in half year ended Sep 2025 is 882.28% vs -11.13% in Sep 2024
Nine Monthly Results Snapshot (Consolidated) - Dec'25
YoY Growth in nine months ended Dec 2025 is 1.44% vs 44.85% in Dec 2024
YoY Growth in nine months ended Dec 2025 is 569.24% vs 4.67% in Dec 2024
Annual Results Snapshot (Consolidated) - Mar'26
YoY Growth in year ended Mar 2026 is -0.79% vs 27.31% in Mar 2025
YoY Growth in year ended Mar 2026 is 16.54% vs 4.04% in Mar 2025
About Indostar Capital Finance Ltd

Company Coordinates


