
 Price Point
Compare Innovassynth Tec with Similar Stocks
ScoreDashboard
Weak Long Term Fundamental Strength with a -343.86% CAGR growth in Operating Profits
With a growth in Net Sales of 356.32%, the company declared Outstanding results in Jun 26
Risky - Negative EBITDA
Despite the size of the company, domestic mutual funds hold only 0.31% of the company
Mojo ParametersStock DNA

Non Banking Financial Company (NBFC)

INR 1,338 Cr (Micro Cap)

NA (Loss Making)
24

0.00%

0.10

-64.51%

30.55
Total ReturnsTotal Returns (Price + Dividend) 
Innovassynth Tec for the last several years.
Risk Adjusted Returns v/s
Returns Beta
 News & Corporate Actions
News
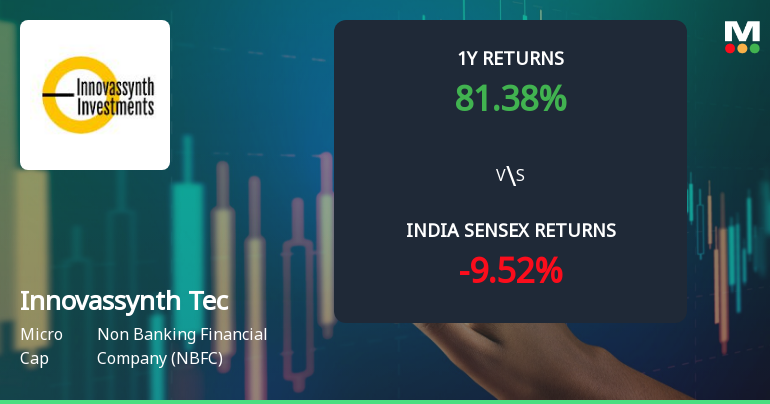
Innovassynth Technologies: Technical Momentum Shifts Signal Bullish Outlook Amid Strong Returns
Innovassynth Technologies (India) Ltd has demonstrated a notable shift in technical momentum, moving from a mildly bullish stance to a more confident bullish trend. This transition is underscored by a combination of key technical indicators including MACD, RSI, moving averages, and Bollinger Bands, signalling renewed investor interest and potential upside in this micro-cap NBFC stock.
Read full news article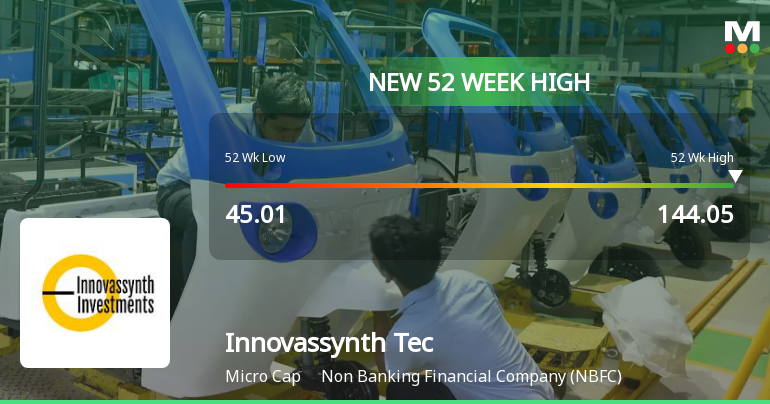
Broad-Based Technical Strength Lifts Innovassynth Technologies (India) Ltd to 52-Week High of Rs 144.05
Surging to a fresh 52-week and all-time high of Rs 144.05 on 15 Sep 2026, Innovassynth Technologies (India) Ltd has demonstrated remarkable price momentum, outperforming its sector by 1.53% on the day. This milestone caps an impressive 81.38% rally over the past year, vastly outpacing the Sensex’s decline of 8.36% during the same period.
Read full news article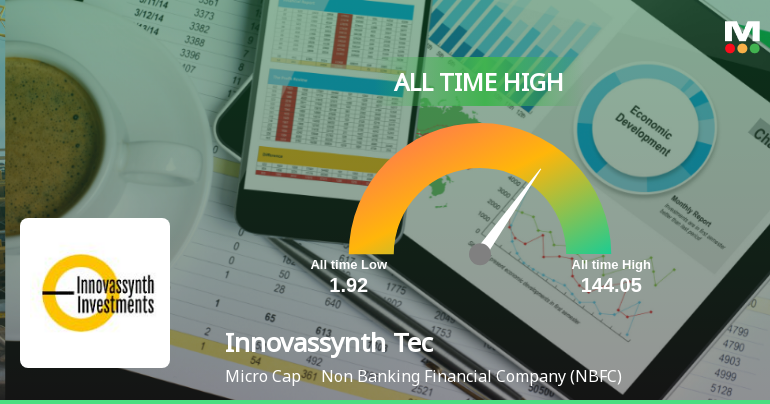
Announcements
Announcement under Regulation 30 (LODR)-Newspaper Publication
09-Sep-2026 | Source : BSENewspaper publication-Notice of 18th Annual General Meeting and e-Voting Information.
Reg. 34 (1) Annual Report.
08-Sep-2026 | Source : BSEAnnual Report of Innovassynth Technologies (India) Limited (the Company) for FY 2025-26.
Notice Of 18Th Annual General Meeting Of The Company
08-Sep-2026 | Source : BSENotice of the 18th Annual General Meeting of the Company
Corporate Actions

No Upcoming Board Meetings

No Dividend history available

No Splits history available

No Bonus history available

Innovassynth Technologies (India) Ltd has announced 3:13 rights issue, ex-date: 29 Apr 26
Key FactorsQuality key factors
Valuation key factors
Technicals key factors
 Technical Indicator Scale: Bearish, Mildly Bearish, Sideways, Mildly Bullish, Bullish Turned Shareholding
Shareholding Snapshot : Jun 2026
Shareholding Compare (%holding)
Promoters
None
Held by 13 Schemes (0.08%)
Held by 8 FIIs (0.0%)
Viren Rajan Raheja (25.42%)
Chanakya Corporate Services Private Limied (3.12%)
16.06%
FinancialQuarterly Results Snapshot (Standalone) - Jun'26 - YoY
 Compare with Peers
YoY Growth in quarter ended Jun 2026 is 356.32% vs 0.00% in Jun 2025
YoY Growth in quarter ended Jun 2026 is 136.10% vs -10,272.22% in Jun 2025

Half Yearly Results Snapshot (Consolidated) - Sep'25
Growth in half year ended Sep 2025 is 0.00% vs 0.00% in Sep 2024
Growth in half year ended Sep 2025 is -0.67% vs -86.77% in Sep 2024
Nine Monthly Results Snapshot (Standalone) - Dec'25

YoY Growth in nine months ended Dec 2025 is -55.98% vs 0.00% in Dec 2024
YoY Growth in nine months ended Dec 2025 is -199.76% vs 1,705.66% in Dec 2024
Annual Results Snapshot (Standalone) - Mar'26
YoY Growth in year ended Mar 2026 is 4.11% vs 0.00% in Mar 2025
YoY Growth in year ended Mar 2026 is -242.88% vs 2,978.57% in Mar 2025
 Company CV
About Innovassynth Technologies (India) Ltd

Company Coordinates










