
Compare Invigorated Bus. with Similar Stocks
Stock DNA
Commercial Services & Supplies
INR 28 Cr (Micro Cap)
NA (Loss Making)
21
0.00%
-0.05
0.12%
-0.15
Total Returns (Price + Dividend) 
Invigorated Bus. for the last several years.
Risk Adjusted Returns v/s
Returns Beta

News
Invigorated Business Consulting Ltd is Rated Strong Sell
Invigorated Business Consulting Ltd is rated Strong Sell by MarketsMOJO. This rating was last updated on 11 Nov 2025. However, all fundamentals, returns, and financial metrics discussed below reflect the company’s current position as of 15 May 2026, providing investors with the latest insights into the stock’s performance and outlook.
Read full news article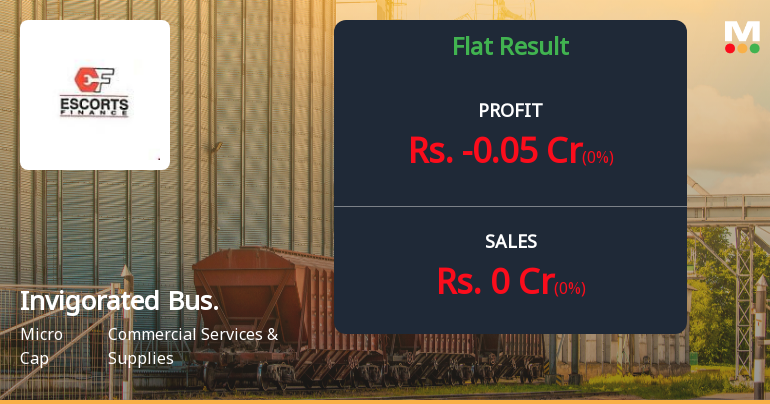
Invigorated Business Consulting Q4 FY26: Persistent Losses Deepen Financial Distress
Invigorated Business Consulting Ltd., formerly known as Escorts Finance Ltd., reported another quarter of losses in Q4 FY26, with a net loss of ₹0.05 crores, maintaining the company's prolonged streak of financial underperformance. The micro-cap firm, with a market capitalisation of just ₹27.00 crores and trading at ₹6.60 per share, continues to grapple with operational challenges that have left shareholders with a negative book value of ₹-44.43 per share. The stock has tumbled 28.26% over the past year, significantly underperforming the broader market and its sector peers.
Read full news article Announcements
Announcement under Regulation 30 (LODR)-Newspaper Publication
29-May-2026 | Source : BSECopy of newspaper publication
Announcement under Regulation 30 (LODR)-Newspaper Publication
01-May-2026 | Source : BSECopies of Newspaper Publication of Financial Results.
Audited Financial Results For The Quarter And Year Ended March 31 2026
30-Apr-2026 | Source : BSEPlease find enclosed herewith the Audited Financial Results.
Corporate Actions

No Upcoming Board Meetings

No Dividend history available

No Splits history available

No Bonus history available

No Rights history available
Quality key factors
Valuation key factors
Technicals key factors
 Technical Indicator Scale: Bearish, Mildly Bearish, Sideways, Mildly Bullish, Bullish Turned
 Shareholding Snapshot : Mar 2026
Shareholding Compare (%holding)
Promoters
None
Held by 0 Schemes
Held by 0 FIIs
Escorts Benefit And Welfare Trust( Mr. Kamal Sachdeva, Trustee) (58.38%)
All Grow Finance & Investment Private Limited (5.26%)
22.96%
Quarterly Results Snapshot (Standalone) - Mar'26 - QoQ
QoQ Growth in quarter ended Mar 2026 is 0.00% vs 0.00% in Dec 2025

QoQ Growth in quarter ended Mar 2026 is 0.00% vs 37.50% in Dec 2025
Half Yearly Results Snapshot (Standalone) - Sep'25
Growth in half year ended Sep 2025 is 0.00% vs 0.00% in Sep 2024
Growth in half year ended Sep 2025 is -750.00% vs 115.38% in Sep 2024
Nine Monthly Results Snapshot (Standalone) - Dec'25
YoY Growth in nine months ended Dec 2025 is 0.00% vs 0.00% in Dec 2024
YoY Growth in nine months ended Dec 2025 is -350.00% vs 69.23% in Dec 2024
Annual Results Snapshot (Standalone) - Mar'26
YoY Growth in year ended Mar 2026 is 0.00% vs 0.00% in Mar 2025
YoY Growth in year ended Mar 2026 is -187.50% vs 60.00% in Mar 2025
About Invigorated Business Consulting Ltd

Company Coordinates


