IRIS Regtech Sol

  • Market Cap: Micro Cap
  • Industry: Software Products
  • ISIN: INE864K01010
  • NSEID: IRIS
  • BSEID: 540735
INR
248.45
-6.55 (-2.57%)
BSENSE

Feb 10

BSE+NSE Vol: 64.77 k

  • Price Points
  • Score
  • Mojo Parameters
  • Total Return
  • News and Corporate Actions
  • Key factors
  • Shareholding
  • Financials
  • CompanyCV
stock-recommendationUpcoming Result: IRIS Regtech Sol will declare its result soon on 14 Feb 2026
stock-summaryPrice Point
High/Low

1Day

52 Week

Valuation
Technical
Day's Volume

CASH

64.77 k (0.49%) Volume

Shareholding (Dec 2025)

FII

1.73%

Held by 3 FIIs

DII

12.90%

Held by 0 DIIs

Promoter

34.63%

how big is IRIS Business?

06-Jun-2025

As of Jun 06, IRIS Business Services Ltd has a market capitalization of 524.00 Cr, classifying it as a Micro Cap company, with recent net sales of 125.97 Cr and net profit of 13.03 Cr over the latest four quarters.

Market Cap: <BR>As of Jun 06, IRIS Business Services Ltd has a market capitalization of 524.00 Cr, which classifies it as a Micro Cap company.<BR><BR>Recent Quarterly Performance: <BR>For the latest 4 quarters, the sum of Net Sales is 125.97 Cr and the sum of Net Profit is 13.03 Cr. This data is consolidated.<BR><BR>Balance Sheet Snapshot: <BR>This is consolidated data for the latest annual period ending in Mar'24. Shareholder's Funds are reported at 40.96 Cr, and Total Assets amount to 75.79 Cr.

View full answer

What does IRIS Business do?

06-Jun-2025

IRIS Business Services Ltd is a micro-cap software company that provides financial software solutions. As of March 2025, it reported net sales of 35 Cr and a net profit of 3 Cr, with a market cap of Rs 521 Cr.

Overview: <BR>IRIS Business Services Ltd operates in the software products industry and is categorized as a micro-cap company.<BR><BR>History: <BR>The company was incorporated in 2000 under the name "IRISBusiness.com (India) Private Limited" and has undergone several name changes, with the latest being "IRIS Business Services Private Limited" in 2009. The most recent quarterly results reported net sales and net profit for March 2025.<BR><BR>Financial Snapshot: <BR>Net Sales: 35 Cr (Quarterly Results - Mar 2025) <BR>Net Profit: 3 Cr (Quarterly Results - Mar 2025) <BR>Market-cap: Rs 521 Cr (Micro Cap)<BR><BR>Key Metrics: <BR>P/E: 40.00 <BR>Industry P/E: 39 <BR>Dividend Yield: 0.00% <BR>Debt-Equity: -0.68 <BR>Return on Equity: 17.22% <BR>Price to Book: 6.89<BR><BR>Contact Details: <BR>Address: T-231 Tower 2 3rd Floor Vashi, International Infotech Park Navi Mumbai Maharashtra : 400703 <BR>Tel: 91-022-67231000 <BR>Email: cs@irisindia.net <BR>Website: http://www.irisbusiness.com

View full answer

Has IRIS Business declared dividend?

06-Jun-2025

No Dividend History Available

Who are the peers of the IRIS Business?

03-Jun-2025

Peers of the IRIS Business include Oracle Fin.Serv., C.E. Info System, Tanla Platforms, and others. Oracle Fin.Serv. shows excellent management risk and capital structure, while IRIS Business has average ratings and a 1-year return of 9.84%.

Peers: The peers of the IRIS Business are Oracle Fin.Serv., C.E. Info System, Tanla Platforms, Moschip Tech., Nucleus Soft., ABM Knowledge, Ace Soft. Exp., Virinchi, Intense Tech., and Odyssey Tech.<BR><BR>Quality Snapshot: Excellent management risk is observed at Oracle Fin.Serv. and the rest have either Good, Average, or Below Average management risk. Growth ratings show that C.E. Info System and Tanla Platforms have Good growth, while IRIS Business, Nucleus Soft., ABM Knowledge, and the rest have Average or Below Average growth. For capital structure, Oracle Fin.Serv., C.E. Info System, Nucleus Soft., ABM Knowledge, and Intense Tech. are rated Excellent, while IRIS Business, Ace Soft. Exp., and the rest have Average or Below Average ratings.<BR><BR>Return Snapshot: The peer with the highest 1-year return is Ace Soft. Exp. at 100.41%, while the lowest is Virinchi at -36.29%. IRIS Business has a 1-year return of 9.84%, which is higher than Virinchi but lower than Ace Soft. Exp. Additionally, several peers, including Moschip Tech., Virinchi, and Odyssey Tech., have negative six-month returns.

View full answer

Is IRIS Business overvalued or undervalued?

25-Jun-2025

As of June 24, 2025, IRIS Business is considered very expensive with a PE ratio of 40.27 and an EV to EBITDA of 24.91, indicating it is overvalued compared to peers like eClerx Services and Firstsource Solutions, despite a strong historical return of 210.83% over three years.

As of 24 June 2025, the valuation grade for IRIS Business has moved from expensive to very expensive, indicating a significant increase in perceived valuation. The company is currently considered overvalued. Key ratios include a PE ratio of 40.27, an EV to EBITDA of 24.91, and a ROCE of 69.45%. <BR><BR>In comparison to its peers, IRIS Business has a higher PE ratio than eClerx Services, which stands at 31.95, and a similar EV to EBITDA ratio to Firstsource Solutions at 24.54. Despite a strong historical performance, with a 3-year return of 210.83% compared to the Sensex's 55.62%, the current valuation metrics suggest that IRIS Business is priced too high relative to its earnings potential and market conditions.

View full answer

Who are in the management team of IRIS Business?

16-Jul-2025

As of March 2023, the management team of IRIS Business includes Swaminathan Subramaniam (CEO), Balachandran Krishnan (CFO), Deepta Rangarajan, and several independent directors, including Vinod Agarwala (Chairman). The team oversees the company's operations and governance.

As of March 2023, the management team of IRIS Business includes the following individuals:<BR><BR>1. Swaminathan Subramaniam - Whole Time Director & CEO<BR>2. Balachandran Krishnan - Whole Time Director & CFO<BR>3. Deepta Rangarajan - Whole-time Director<BR>4. Ashok Venkatramani - Non-Executive & Independent Director<BR>5. B Mukherjee - Non-Executive & Independent Director<BR>6. Vinod Agarwala - Chairman & Independent Director<BR>7. Haseeb A Drabu - Non-Executive & Independent Director<BR>8. Puthenpurackal Kuncheria Xavier Thomas - Whole Time Director & CTO<BR><BR>This team comprises a mix of executive and independent directors, overseeing various aspects of the company's operations and governance.

View full answer

Who are the top shareholders of the IRIS Business?

17-Jul-2025

The top shareholders of IRIS Business are Subramaniam Swaminathan with 21.77%, followed by Subhkam Ventures I Private Limited at 5.79%, and individual investors holding 37.49%. There are no pledged promoter holdings or mutual funds invested in the company.

The top shareholders of IRIS Business include Subramaniam Swaminathan, who holds the largest share at 21.77%. Following him, the highest public shareholder is Subhkam Ventures I Private Limited, with a stake of 5.79%. Additionally, individual investors collectively hold 37.49% of the company. There are also two Foreign Institutional Investors (FIIs) that hold a combined 1.42%. Notably, there are no pledged promoter holdings and no mutual funds currently invested in the company.

View full answer

Are IRIS Business latest results good or bad?

13-Aug-2025

The latest results for IRIS Business Services are disappointing, with a 128.48% decline in Profit Before Tax and a 93.6% drop in Profit After Tax compared to last year, indicating significant challenges in profitability despite a modest 7.99% growth in net sales. Overall, the financial performance reflects a troubling trend.

The latest results for IRIS Business Services are quite disappointing. The company reported a significant decline in key financial metrics for the quarter ending June 2025. Profit Before Tax less Other Income (PBT) fell to Rs -0.88 crore, which is a staggering decrease of 128.48% year-on-year. This indicates a troubling trend in profitability.<BR><BR>Profit After Tax (PAT) also dropped sharply to Rs 0.18 crore, reflecting a 93.6% decrease compared to the same period last year. The operating profit was recorded at Rs 0.01 crore, the lowest in the past five quarters, and the operating profit margin decreased to just 0.03%, marking a decline in operational efficiency.<BR><BR>Additionally, the earnings per share (EPS) fell to Rs 0.09, further underscoring the decline in profitability and returns for shareholders. While net sales did show a modest growth of 7.99%, this is a significant drop from the previous year's growth of 34.03%. Overall, IRIS Business Services is facing considerable challenges in its financial performance, indicating that the latest results are indeed bad.

View full answer

When is the next results date for IRIS Business?

07-Nov-2025

The next results date for IRIS Business is 13 November 2025.

The next results date for IRIS Business is scheduled for 13 November 2025.

View full answer

How has been the historical performance of IRIS Business?

13-Nov-2025

IRIS Business has shown significant growth in net sales and profitability, with net sales increasing from 39.89 Cr in March 2019 to 125.97 Cr in March 2025, and profit after tax improving from a loss of 6.10 Cr to 13.25 Cr during the same period. The company has demonstrated a strong recovery, with positive cash flow and balanced growth in assets and liabilities.

Answer:<BR>The historical performance of IRIS Business shows a significant upward trend in net sales and profitability over the years, culminating in the fiscal year ending March 2025.<BR><BR>Breakdown:<BR>IRIS Business has demonstrated consistent growth in net sales, increasing from 39.89 Cr in March 2019 to 125.97 Cr in March 2025. Total operating income followed a similar trajectory, reaching 125.97 Cr in March 2025, up from 39.89 Cr in March 2019. The company's total expenditure also rose, but at a slower pace, resulting in an operating profit (PBDIT) of 21.54 Cr in March 2025, compared to 46.65 Cr in March 2019. Profit before tax improved significantly to 18.55 Cr in March 2025 from a loss of 5.36 Cr in March 2019, while profit after tax reached 13.25 Cr, up from a loss of 6.10 Cr in March 2019. The earnings per share (EPS) increased to 6.34 in March 2025 from -3.24 in March 2019, reflecting enhanced shareholder value. The company's total assets grew to 124.12 Cr in March 2025, up from 57.24 Cr in March 2020, while total liabilities also increased to 124.12 Cr, indicating a balanced growth in both assets and liabilities. Cash flow from operating activities showed a positive trend, reaching 27.00 Cr in March 2025, contributing to a net cash inflow of 18.00 Cr for the same period. Overall, IRIS Business has shown a robust recovery and growth trajectory in its financial performance over the years.

View full answer

Should I buy, sell or hold IRIS Business?

15-Nov-2025

Is IRIS Business technically bullish or bearish?

03-Dec-2025

As of December 2, 2025, the technical trend has shifted to a bearish stance with moderate strength, indicated by bearish MACD, Bollinger Bands, and moving averages, despite mixed signals from the KST and OBV.

As of 2 December 2025, the technical trend has changed from mildly bearish to bearish. The current stance is bearish with moderate strength. Key indicators include a bearish MACD on the weekly timeframe, bearish Bollinger Bands on both weekly and monthly timeframes, and bearish moving averages on the daily timeframe. The KST is also bearish on the weekly chart, while the OBV shows a mildly bearish trend on the weekly but mildly bullish on the monthly, indicating mixed signals. Overall, the bearish indicators dominate the analysis.

View full answer

Why is IRIS Regtech Solutions Ltd falling/rising?

10-Feb-2026

As of 10-Feb, the stock price of IRIS Regtech Solutions Ltd is currently at 248.45, reflecting a decline of 2.57%. The stock has significantly underperformed, with a year-to-date decrease of 18.27% and a one-year decline of 41.01%, amidst reduced investor interest and bearish trading signals.

As of 10-Feb, the stock price of IRIS Regtech Solutions Ltd is falling, currently at 248.45, which reflects a decrease of 6.55 or 2.57%. This decline is supported by several factors. Over the past week, the stock has underperformed significantly, with a drop of 16.01%, while the benchmark Sensex has increased by 0.64%. The one-month performance shows a similar trend, with the stock down 15.48% compared to a 0.83% rise in the Sensex.<BR><BR>Year-to-date, the stock has decreased by 18.27%, while the Sensex has only fallen by 1.11%. Over the past year, the stock has experienced a substantial decline of 41.01%, contrasting sharply with the Sensex's gain of 9.01%. Although the stock has shown impressive growth over the longer term, with increases of 205.03% over three years and 562.53% over five years, the recent performance indicates a significant downturn.<BR><BR>Today's trading activity also reflects negative sentiment, as the stock has underperformed its sector by 1.16%. It reached an intraday low of Rs 247, marking a decline of 3.14%. The weighted average price indicates that more volume was traded closer to this low price, suggesting a lack of buying interest. Additionally, the stock is trading below its 5-day, 20-day, 50-day, 100-day, and 200-day moving averages, which typically signals bearish momentum. <BR><BR>Investor participation has also decreased, with delivery volume falling by 38.01% against the 5-day average, indicating reduced interest from investors. While the stock remains liquid enough for trading, these factors collectively contribute to the ongoing decline in IRIS Regtech Solutions Ltd's stock price.

View full answer
iScoreScore
Click here to find our call on this stock
Strong Sell
Sell
Hold
Buy
Strong Buy

Dashboard

1

With ROE of 12, it has a Very Expensive valuation with a 2.7 Price to Book Value

  • The stock is trading at a discount compared to its peers' average historical valuations
  • Over the past year, while the stock has generated a return of -41.01%, its profits have risen by 74.4% ; the PEG ratio of the company is 0.3
2

Despite the size of the company, domestic mutual funds hold only 0% of the company

3

Underperformed the market in the last 1 year

stock-summaryMojo Parameters

Mojo Parameters

Loading Valuation Snapshot...

Stock DNA

stock-summary
Industry

Software Products

stock-summary
Market cap

INR 514 Cr (Micro Cap)

stock-summary
P/E

23.00

stock-summary
Industry P/E

28

stock-summary
Dividend Yield

0.00%

stock-summary
Debt Equity

-0.46

stock-summary
Return on Equity

12.00%

stock-summary
Price to Book

2.74

Revenue and Profits:
Net Sales:
29 Cr
(Quarterly Results - Sep 2025)
Net Profit:
117 Cr
stock-summaryTotal Returns
Total Returns (Price + Dividend) stock-summary
Dividend Yield (0%)
TimePeriod
Price Return
Dividend Return
Total Return
3 Months
-32.25%
0%
-32.25%
6 Months
-30.99%
0%
-30.99%
1 Year
-41.01%
0%
-41.01%
2 Years
60.29%
0%
60.29%
3 Years
205.03%
0%
205.03%
4 Years
89.3%
0%
89.3%
5 Years
562.53%
0%
562.53%

IRIS Regtech Sol for the last several years.

Risk Adjusted Returns v/s stock-summary
Returns Beta
Icon
Beta has not been calculated since enough price history is not available
stock-summaryNews & Corporate Actions

News

Why is IRIS Regtech Solutions Ltd falling/rising?

Recent Price Movement and Market Context

The stock has experienced a sharp correction over the past week, losing 21.08% compared to a 1.59% gain in the Sensex. Over the last month, IRIS Regtech Solutions has declined by 19.16%, markedly underperforming the broader market, which fell by only 1.74% during the same period. Year-to-date, the stock is down 18.96%, while the Sensex has declined by a marginal 1.92%. This trend extends over the last twelve months, where the stock has plummeted 43.82%, in stark contrast to the Sensex’s 7.07% gain.

On the day in question, the stock underperformed its sector, the BPO/ITeS segment, which itself declined by 4.14%. IRIS Regtech Solutions’ share price touched an intraday low of ₹239.85, representing an 8.4% drop from previous levels....

Read full news article
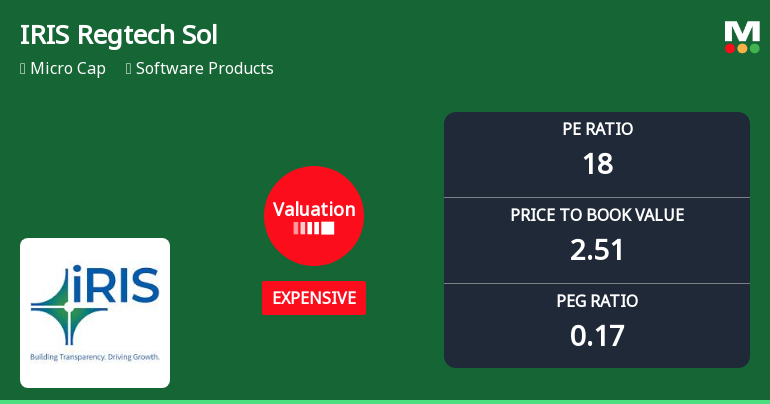
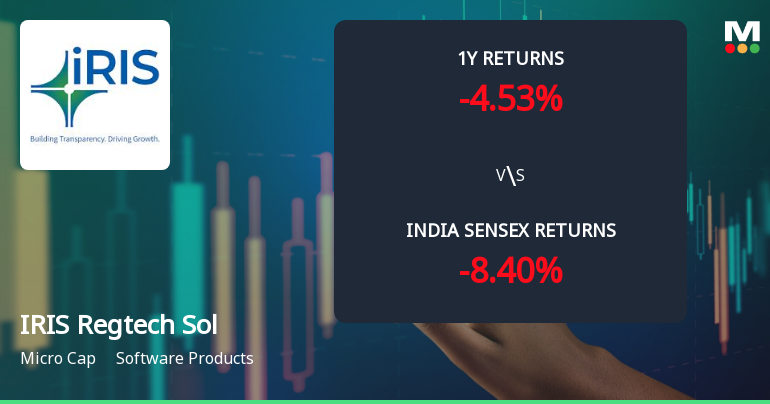
Announcements stock-summary

Board Meeting Intimation for Approval Of Unaudited Financial Results.

07-Feb-2026 | Source : BSE

IRIS Regtech Solutions Ltdhas informed BSE that the meeting of the Board of Directors of the Company is scheduled on 14/02/2026 inter alia to consider and approve Unaudited Financial Results for the quarter ended December 31 2026.

Announcement under Regulation 30 (LODR)-Award_of_Order_Receipt_of_Order

29-Jan-2026 | Source : BSE

We are pleased to announce that the Company has received an award from NEC Corporation India Private Limited.

Shareholder Meeting / Postal Ballot-Outcome of Postal_Ballot

19-Jan-2026 | Source : BSE

We hereby submit outcome of Postal Ballot.

Corporate Actions stock-summary

stock-summary
BOARD MEETING

14 Feb 2026

stock-summary
DIVIDEND

No Dividend history available

stock-summary
SPLITS

No Splits history available

stock-summary
BONUS

No Bonus history available

stock-summary
RIGHTS

No Rights history available

stock-summaryKey Factors

Quality key factors stock-summary

Factor
Value
Sales Growth (5y)
15.32%
EBIT Growth (5y)
33.38%
EBIT to Interest (avg)
7.05
Debt to EBITDA (avg)
0.52
Net Debt to Equity (avg)
-0.46
Sales to Capital Employed (avg)
1.71
Tax Ratio
31.85%
Dividend Payout Ratio
0
Pledged Shares
0
Institutional Holding
14.63%
ROCE (avg)
26.48%
ROE (avg)
14.22%

Valuation key factors

Factor
Value
P/E Ratio
23
Industry P/E
28
Price to Book Value
2.70
EV to EBIT
50.38
EV to EBITDA
39.89
EV to Capital Employed
4.18
EV to Sales
3.49
PEG Ratio
0.33
Dividend Yield
NA
ROCE (Latest)
8.29%
ROE (Latest)
12.00%

Technicals key factors

Indicator
Weekly
Monthly
MACD
Bearish
Mildly Bearish
RSI
No Signal
Bullish
Bollinger Bands
Mildly Bearish
Bearish
Moving Averages
Bearish (Daily)
KST
Bearish
Mildly Bearish
Dow Theory
No Trend
Mildly Bearish
OBV
No Trend
Mildly Bearish
stock-summary Technical Indicator Scale: Bearish, Mildly Bearish, Sideways, Mildly Bullish, Bullish  Turned 
stock-summaryShareholding
Shareholding Snapshot : Dec 2025stock-summary
Shareholding Compare (%holding) stock-summary
Majority shareholders

Non Institution

Pledged Promoter Holdings

None

Mutual Funds

Held by 0 Schemes

FIIs

Held by 3 FIIs (1.73%)

Promoter with highest holding

Deepta Rangarajan (28.77%)

Highest Public shareholder

Subhkam Ventures I Private Limited (7.52%)

Individual Investors Holdings

36.47%

stock-summaryFinancial
[
  {
    "link": "quarterly",
    "btn_text": "All Quarterly Results",
    "header": "Quarterly Results Snapshot (Consolidated) - Sep'25 - YoY",
    "rhs": [
      {
        "prefix": "Net Sales ",
        "suffix": "YoY Growth in quarter ended Sep 2025 is 6.13% vs 12.27% in Sep 2024",
        "dir": -1
      },
      {
        "prefix": "Consolidated Net Profit ",
        "suffix": "YoY Growth in quarter ended Sep 2025 is 2,935.06% vs 189.47% in Sep 2024",
        "dir": 1
      }
    ],
    "table": {
      "header": [
        "Sep'25",
        "Sep'24",
        "Change(%)"
      ],
      "body": [
        {
          "field": "Net Sales",
          "val1": "28.56",
          "val2": "26.91",
          "chgp": "6.13%",
          "chgp_class": "positive"
        },
        {
          "field": "Operating Profit (PBDIT) excl Other Income",
          "val1": "0.15",
          "val2": "4.73",
          "chgp": "-96.83%",
          "chgp_class": "negative"
        },
        {
          "field": "Interest",
          "val1": "0.08",
          "val2": "0.22",
          "chgp": "-63.64%",
          "chgp_class": "positive"
        },
        {
          "field": "Exceptional Items",
          "val1": "115.01",
          "val2": "0.12",
          "chgp": "95,741.67%",
          "chgp_class": "positive"
        },
        {
          "field": "Consolidate Net Profit",
          "val1": "116.85",
          "val2": "3.85",
          "chgp": "2,935.06%",
          "chgp_class": "positive"
        },
        {
          "field": "Operating Profit Margin (Excl OI)",
          "val1": "0.53%",
          "val2": "17.58%",
          "chgp": "-17.05%",
          "chgp_class": "negative"
        }
      ]
    }
  },
  {
    "link": "half-yearly",
    "btn_text": "All Half Yearly Results",
    "header": "Half Yearly Results Snapshot (Consolidated) - Sep'25",
    "rhs": [
      {
        "prefix": "Net Sales ",
        "suffix": " Growth in half year ended Sep 2025 is 5.25% vs 14.53% in Sep 2024",
        "dir": -1
      },
      {
        "prefix": "Consolidated Net Profit ",
        "suffix": " Growth in half year ended Sep 2025 is 1,654.57% vs 196.44% in Sep 2024",
        "dir": 1
      }
    ],
    "table": {
      "header": [
        "Sep'25",
        "Sep'24",
        "Change(%)"
      ],
      "body": [
        {
          "field": "Net Sales",
          "val1": "53.76",
          "val2": "51.08",
          "chgp": "5.25%",
          "chgp_class": "positive"
        },
        {
          "field": "Operating Profit (PBDIT) excl Other Income",
          "val1": "0.40",
          "val2": "8.25",
          "chgp": "-95.15%",
          "chgp_class": "negative"
        },
        {
          "field": "Interest",
          "val1": "0.24",
          "val2": "0.40",
          "chgp": "-40.00%",
          "chgp_class": "positive"
        },
        {
          "field": "Exceptional Items",
          "val1": "114.87",
          "val2": "0.21",
          "chgp": "54,600.00%",
          "chgp_class": "positive"
        },
        {
          "field": "Consolidate Net Profit",
          "val1": "117.03",
          "val2": "6.67",
          "chgp": "1,654.57%",
          "chgp_class": "positive"
        },
        {
          "field": "Operating Profit Margin (Excl OI)",
          "val1": "0.74%",
          "val2": "16.15%",
          "chgp": "-15.41%",
          "chgp_class": "negative"
        }
      ]
    }
  },
  {
    "link": "nine-monthly",
    "btn_text": "All Nine Monthly Results",
    "header": "Nine Monthly Results Snapshot (Consolidated) - Dec'24",
    "rhs": [
      {
        "prefix": "Net Sales ",
        "suffix": "YoY Growth in nine months ended Dec 2024 is 16.64% vs 35.68% in Dec 2023",
        "dir": -1
      },
      {
        "prefix": "Consolidated Net Profit ",
        "suffix": "YoY Growth in nine months ended Dec 2024 is 156.53% vs 47.96% in Dec 2023",
        "dir": 1
      }
    ],
    "table": {
      "header": [
        "Dec'24",
        "Dec'23",
        "Change(%)"
      ],
      "body": [
        {
          "field": "Net Sales",
          "val1": "83.91",
          "val2": "71.94",
          "chgp": "16.64%",
          "chgp_class": "positive"
        },
        {
          "field": "Operating Profit (PBDIT) excl Other Income",
          "val1": "13.44",
          "val2": "8.80",
          "chgp": "52.73%",
          "chgp_class": "positive"
        },
        {
          "field": "Interest",
          "val1": "0.59",
          "val2": "0.79",
          "chgp": "-25.32%",
          "chgp_class": "positive"
        },
        {
          "field": "Exceptional Items",
          "val1": "0.21",
          "val2": "0.00",
          "chgp": "",
          "chgp_class": "neutral"
        },
        {
          "field": "Consolidate Net Profit",
          "val1": "10.21",
          "val2": "3.98",
          "chgp": "156.53%",
          "chgp_class": "positive"
        },
        {
          "field": "Operating Profit Margin (Excl OI)",
          "val1": "16.02%",
          "val2": "12.23%",
          "chgp": "3.79%",
          "chgp_class": "positive"
        }
      ]
    }
  },
  {
    "link": "annual",
    "btn_text": "All Annual Results",
    "header": "Annual Results Snapshot (Consolidated) - Mar'25",
    "rhs": [
      {
        "prefix": "Net Sales ",
        "suffix": "YoY Growth in year ended Mar 2025 is 7.21% vs 39.05% in Mar 2024",
        "dir": -1
      },
      {
        "prefix": "Consolidated Net Profit ",
        "suffix": "YoY Growth in year ended Mar 2025 is 49.94% vs 103.51% in Mar 2024",
        "dir": -1
      }
    ],
    "table": {
      "header": [
        "Mar'25",
        "Mar'24",
        "Change(%)"
      ],
      "body": [
        {
          "field": "Net Sales",
          "val1": "109.68",
          "val2": "102.30",
          "chgp": "7.21%",
          "chgp_class": "positive"
        },
        {
          "field": "Operating Profit (PBDIT) excl Other Income",
          "val1": "18.97",
          "val2": "15.23",
          "chgp": "24.56%",
          "chgp_class": "positive"
        },
        {
          "field": "Interest",
          "val1": "0.78",
          "val2": "1.15",
          "chgp": "-32.17%",
          "chgp_class": "positive"
        },
        {
          "field": "Exceptional Items",
          "val1": "-0.40",
          "val2": "0.00",
          "chgp": "",
          "chgp_class": "neutral"
        },
        {
          "field": "Consolidate Net Profit",
          "val1": "13.03",
          "val2": "8.69",
          "chgp": "49.94%",
          "chgp_class": "positive"
        },
        {
          "field": "Operating Profit Margin (Excl OI)",
          "val1": "17.30%",
          "val2": "14.89%",
          "chgp": "2.41%",
          "chgp_class": "positive"
        }
      ]
    }
  }
]

Quarterly Results Snapshot (Consolidated) - Sep'25 - YoYstock-summary

Sep'25
Sep'24
Change(%)
Net Sales
28.56
26.91
6.13%
Operating Profit (PBDIT) excl Other Income
0.15
4.73
-96.83%
Interest
0.08
0.22
-63.64%
Exceptional Items
115.01
0.12
95,741.67%
Consolidate Net Profit
116.85
3.85
2,935.06%
Operating Profit Margin (Excl OI)
0.53%
17.58%
-17.05%
Values in Rs Cr.
Direction Arrows
Net Sales

YoY Growth in quarter ended Sep 2025 is 6.13% vs 12.27% in Sep 2024

Direction Arrows
Consolidated Net Profit

YoY Growth in quarter ended Sep 2025 is 2,935.06% vs 189.47% in Sep 2024

Half Yearly Results Snapshot (Consolidated) - Sep'25stock-summary

Sep'25
Sep'24
Change(%)
Net Sales
53.76
51.08
5.25%
Operating Profit (PBDIT) excl Other Income
0.40
8.25
-95.15%
Interest
0.24
0.40
-40.00%
Exceptional Items
114.87
0.21
54,600.00%
Consolidate Net Profit
117.03
6.67
1,654.57%
Operating Profit Margin (Excl OI)
0.74%
16.15%
-15.41%
Values in Rs Cr.
Direction Arrows
Net Sales

Growth in half year ended Sep 2025 is 5.25% vs 14.53% in Sep 2024

Direction Arrows
Consolidated Net Profit

Growth in half year ended Sep 2025 is 1,654.57% vs 196.44% in Sep 2024

Nine Monthly Results Snapshot (Consolidated) - Dec'24stock-summary

Dec'24
Dec'23
Change(%)
Net Sales
83.91
71.94
16.64%
Operating Profit (PBDIT) excl Other Income
13.44
8.80
52.73%
Interest
0.59
0.79
-25.32%
Exceptional Items
0.21
0.00
Consolidate Net Profit
10.21
3.98
156.53%
Operating Profit Margin (Excl OI)
16.02%
12.23%
3.79%
Values in Rs Cr.
Direction Arrows
Net Sales

YoY Growth in nine months ended Dec 2024 is 16.64% vs 35.68% in Dec 2023

Direction Arrows
Consolidated Net Profit

YoY Growth in nine months ended Dec 2024 is 156.53% vs 47.96% in Dec 2023

Annual Results Snapshot (Consolidated) - Mar'25stock-summary

Mar'25
Mar'24
Change(%)
Net Sales
109.68
102.30
7.21%
Operating Profit (PBDIT) excl Other Income
18.97
15.23
24.56%
Interest
0.78
1.15
-32.17%
Exceptional Items
-0.40
0.00
Consolidate Net Profit
13.03
8.69
49.94%
Operating Profit Margin (Excl OI)
17.30%
14.89%
2.41%
Values in Rs Cr.
Direction Arrows
Net Sales

YoY Growth in year ended Mar 2025 is 7.21% vs 39.05% in Mar 2024

Direction Arrows
Consolidated Net Profit

YoY Growth in year ended Mar 2025 is 49.94% vs 103.51% in Mar 2024

stock-summaryCompany CV
About IRIS Regtech Solutions Ltd stock-summary
stock-summary
IRIS Regtech Solutions Ltd
Micro Cap
Software Products
IRIS Business Services Limited was incorporated as a Private Limited Company as "IRISBusiness.com (India) Private Limited" at Mumbai Maharashtra on October 03, 2000. The name of the Company was changed to "IRISBusiness Services (India) Private Limited" on October 27, 2003 and further to "IRIS Business Services Private Limited" on July 13, 2009. Consequently, it was converted into a Public Limited Company w.e.f. June 29, 2010.
Company Coordinates stock-summary
Company Details
T-231 Tower 2 3rd Floor Vashi, International Infotech Park Navi Mumbai Maharashtra : 400703
stock-summary
Tel: 91-022-67231000
stock-summary
cs@irisindia.net
Registrar Details
Link Intime India Pvt Ltd, C-13 Pannalal Silk Compound, L B S Marg, Bhandup , Mumbai