
Compare IVP with Similar Stocks
Dashboard
With a growth in Net Profit of 91.36%, the company declared Very Positive results in Mar 26
- The company has declared positive results for the last 3 consecutive quarters
- PAT(9M) At Rs 17.83 cr has Grown at 126.33%
- OPERATING PROFIT TO INTEREST(Q) Highest at 10.00 times
- NET SALES(Q) Highest at Rs 164.44 cr
With ROCE of 7.9, it has a Attractive valuation with a 1.1 Enterprise value to Capital Employed
Majority shareholders : Promoters
Stock DNA
Commodity Chemicals
INR 165 Cr (Micro Cap)
9.00
13
0.64%
0.69
13.21%
1.12
Total Returns (Price + Dividend) 
Latest dividend: 1 per share ex-dividend date: Jul-24-2025
Risk Adjusted Returns v/s
Returns Beta

News
IVP Ltd Upgraded to Buy by MarketsMOJO on Strong Financial and Technical Improvements
IVP Ltd, a micro-cap player in the commodity chemicals sector, has seen its investment rating upgraded from Hold to Buy by MarketsMOJO as of 12 June 2026. This upgrade reflects a confluence of improved technical indicators, robust financial performance, attractive valuation metrics, and a solid quality assessment, signalling renewed investor confidence despite recent price volatility.
Read full news article
IVP Ltd is Rated Buy by MarketsMOJO
IVP Ltd is rated 'Buy' by MarketsMOJO, with this rating last updated on 12 June 2026. However, the analysis and financial metrics discussed here reflect the stock's current position as of 14 June 2026, providing investors with the most up-to-date insight into the company’s performance and outlook.
Read full news article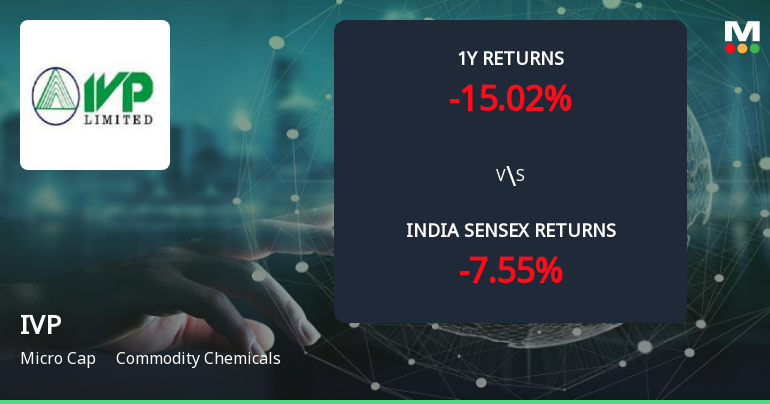
Golden Cross Forms in IVP Ltd — On a Day the Stock Fell 2.45%. What the Mixed Signals Mean
The 50-day moving average has crossed above the 200-day moving average for IVP Ltd, signalling a golden cross on 12 Jun 2026. Yet, the stock declined 2.45% on the same day, while monthly technical indicators remain bearish. This divergence between the moving averages and price action calls for a detailed examination of the signal’s reliability.
Read full news article Announcements
Announcement under Regulation 30 (LODR)-Newspaper Publication
11-Jun-2026 | Source : BSEWe are enclosing the copies of Newspaper Advertisement pertaining to Notice of transfer of Equity Shares of the Company to IEPF.
Intimation Under Regulation 30 Of The SEBI (Listing Obligations And Disclosure Requirements) Regulations 2015 - Order Passed By Office Of Estate Officer Mumbai Port Trust (MBPT).
11-Jun-2026 | Source : BSEThe Company hereby intimates regarding the receipt of order from the office of Estate officer Mumbai Port Trust (MBPT).
Announcement under Regulation 30 (LODR)-Investor Presentation
04-Jun-2026 | Source : BSEInvestor presentation with respect to the audited financial results for the quarter and year ended March 31 2026
Corporate Actions

No Upcoming Board Meetings

IVP Ltd has declared 10% dividend, ex-date: 24 Jul 25

No Splits history available

No Bonus history available

No Rights history available
Quality key factors
Valuation key factors
Technicals key factors
 Technical Indicator Scale: Bearish, Mildly Bearish, Sideways, Mildly Bullish, Bullish Turned
 Shareholding Snapshot : Mar 2026
Shareholding Compare (%holding)
Promoters
None
Held by 0 Schemes
Held by 0 FIIs
Allana Exports Private Limited (34.31%)
Gaurav Naresh Lodha (1.21%)
23.66%
Quarterly Results Snapshot (Standalone) - Mar'26 - QoQ

QoQ Growth in quarter ended Mar 2026 is 13.43% vs -1.35% in Dec 2025
QoQ Growth in quarter ended Mar 2026 is 91.36% vs 15.75% in Dec 2025
Half Yearly Results Snapshot (Standalone) - Sep'25
Growth in half year ended Sep 2025 is 9.56% vs -7.56% in Sep 2024

Growth in half year ended Sep 2025 is -7.16% vs -4.12% in Sep 2024
Nine Monthly Results Snapshot (Standalone) - Dec'25
YoY Growth in nine months ended Dec 2025 is 10.39% vs -3.53% in Dec 2024
YoY Growth in nine months ended Dec 2025 is 31.28% vs -0.80% in Dec 2024
Annual Results Snapshot (Standalone) - Mar'26
YoY Growth in year ended Mar 2026 is 10.31% vs -1.30% in Mar 2025
YoY Growth in year ended Mar 2026 is 65.16% vs -7.90% in Mar 2025
About IVP Ltd

Company Coordinates


